| __timestamp | Old Dominion Freight Line, Inc. | The Boeing Company |
|---|---|---|
| Wednesday, January 1, 2014 | 144817000 | 3767000000 |
| Thursday, January 1, 2015 | 153589000 | 3525000000 |
| Friday, January 1, 2016 | 152391000 | 3616000000 |
| Sunday, January 1, 2017 | 177205000 | 4094000000 |
| Monday, January 1, 2018 | 194368000 | 4567000000 |
| Tuesday, January 1, 2019 | 206125000 | 3909000000 |
| Wednesday, January 1, 2020 | 184185000 | 4817000000 |
| Friday, January 1, 2021 | 223757000 | 4157000000 |
| Saturday, January 1, 2022 | 258883000 | 4187000000 |
| Sunday, January 1, 2023 | 281053000 | 5168000000 |
| Monday, January 1, 2024 | 5021000000 |
Unlocking the unknown
In the ever-evolving landscape of corporate finance, understanding the trends in Selling, General, and Administrative (SG&A) expenses is crucial for investors and analysts alike. This chart provides a comparative analysis of SG&A expenses for The Boeing Company and Old Dominion Freight Line, Inc. from 2014 to 2023.
Boeing, a titan in the aerospace industry, consistently reported higher SG&A expenses, peaking in 2023 with a 38% increase from 2014. This reflects its expansive operations and the complexities of managing a global enterprise. In contrast, Old Dominion Freight Line, a leader in the freight industry, demonstrated a steady growth in SG&A expenses, with a notable 94% rise over the same period, indicating strategic investments in operational efficiency and market expansion.
Interestingly, the data for 2024 is incomplete, highlighting the dynamic nature of financial reporting and the need for continuous monitoring.
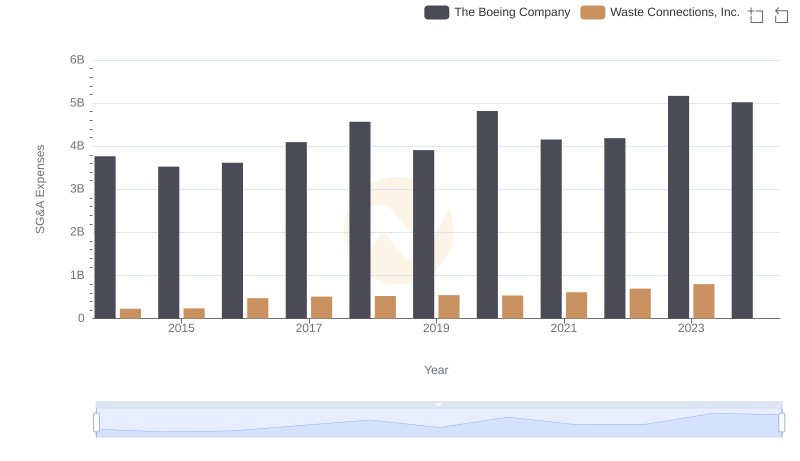
Who Optimizes SG&A Costs Better? The Boeing Company or Waste Connections, Inc.

Comparing SG&A Expenses: The Boeing Company vs Quanta Services, Inc. Trends and Insights
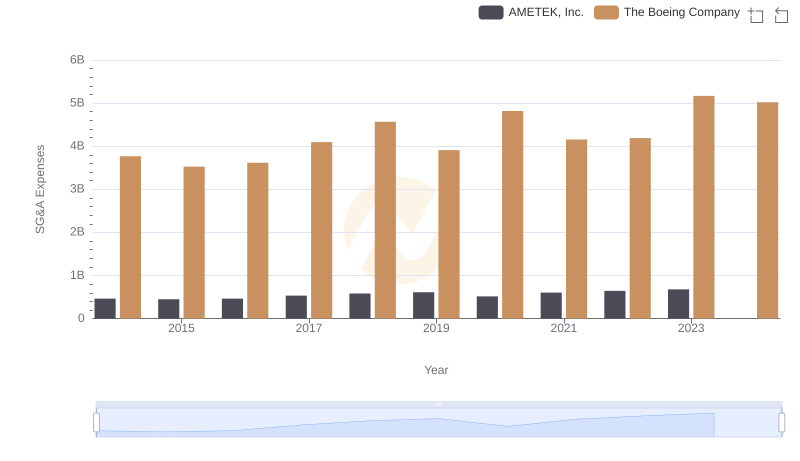
Selling, General, and Administrative Costs: The Boeing Company vs AMETEK, Inc.
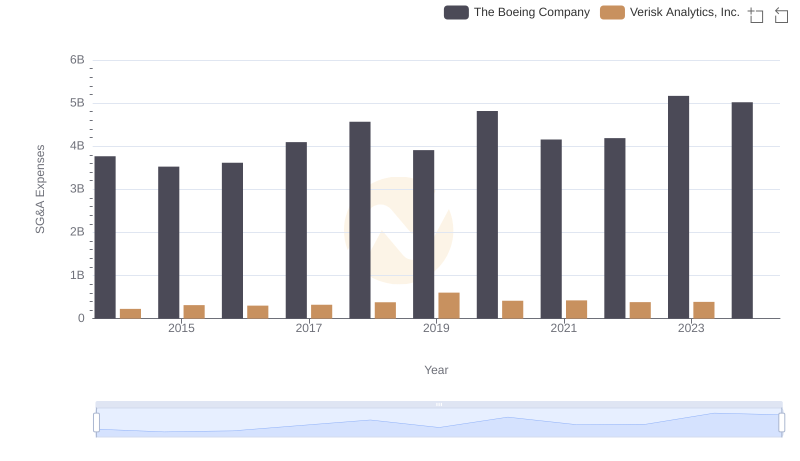
Cost Management Insights: SG&A Expenses for The Boeing Company and Verisk Analytics, Inc.