| __timestamp | Hubbell Incorporated | The Boeing Company |
|---|---|---|
| Wednesday, January 1, 2014 | 591600000 | 3767000000 |
| Thursday, January 1, 2015 | 617200000 | 3525000000 |
| Friday, January 1, 2016 | 622900000 | 3616000000 |
| Sunday, January 1, 2017 | 648200000 | 4094000000 |
| Monday, January 1, 2018 | 743500000 | 4567000000 |
| Tuesday, January 1, 2019 | 756100000 | 3909000000 |
| Wednesday, January 1, 2020 | 676300000 | 4817000000 |
| Friday, January 1, 2021 | 619200000 | 4157000000 |
| Saturday, January 1, 2022 | 762500000 | 4187000000 |
| Sunday, January 1, 2023 | 848600000 | 5168000000 |
| Monday, January 1, 2024 | 812500000 | 5021000000 |
Cracking the code
Over the past decade, the Selling, General, and Administrative (SG&A) expenses of The Boeing Company and Hubbell Incorporated have showcased intriguing trends. Boeing, a titan in aerospace, consistently outpaces Hubbell, a leader in electrical products, in SG&A spending. From 2014 to 2023, Boeing's SG&A expenses grew by approximately 37%, peaking in 2023. In contrast, Hubbell's expenses increased by about 43% over the same period, reflecting a steady upward trajectory. Notably, 2023 marked a significant year for both companies, with Boeing reaching its highest SG&A expense, while Hubbell also saw a substantial rise. However, data for 2024 is incomplete, leaving room for speculation on future trends. This financial analysis provides a window into the strategic priorities and operational scales of these industry giants, offering valuable insights for investors and analysts alike.
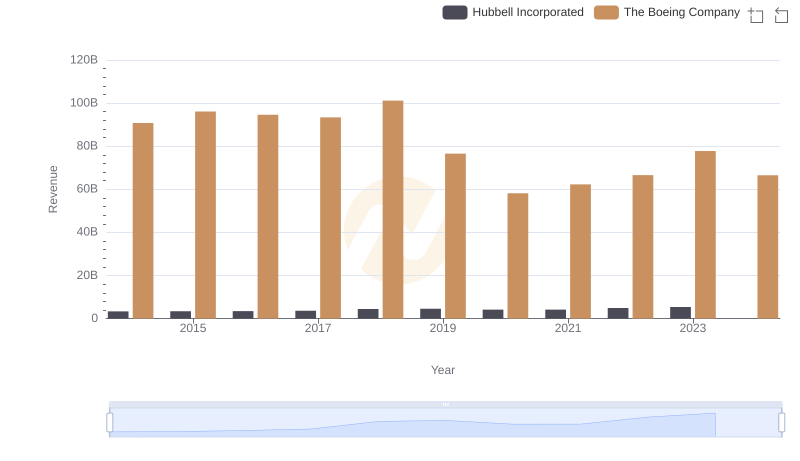
Who Generates More Revenue? The Boeing Company or Hubbell Incorporated
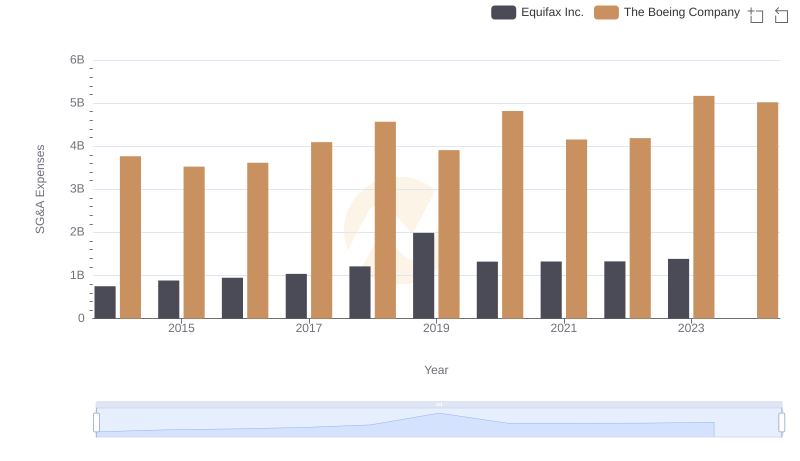
Comparing SG&A Expenses: The Boeing Company vs Equifax Inc. Trends and Insights
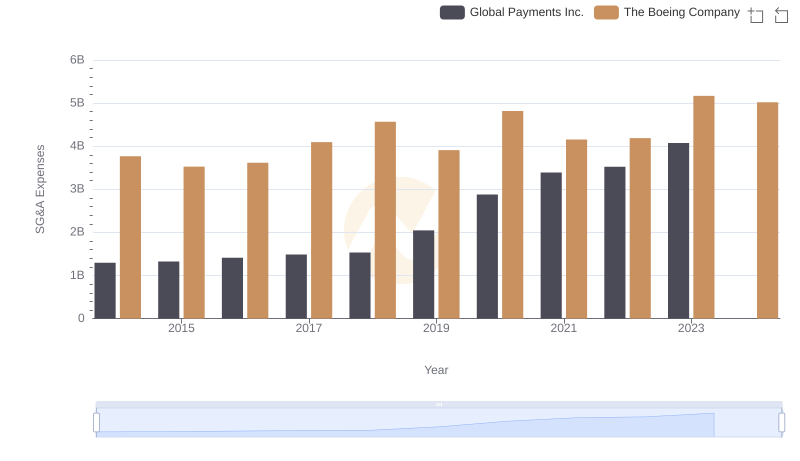
Comparing SG&A Expenses: The Boeing Company vs Global Payments Inc. Trends and Insights
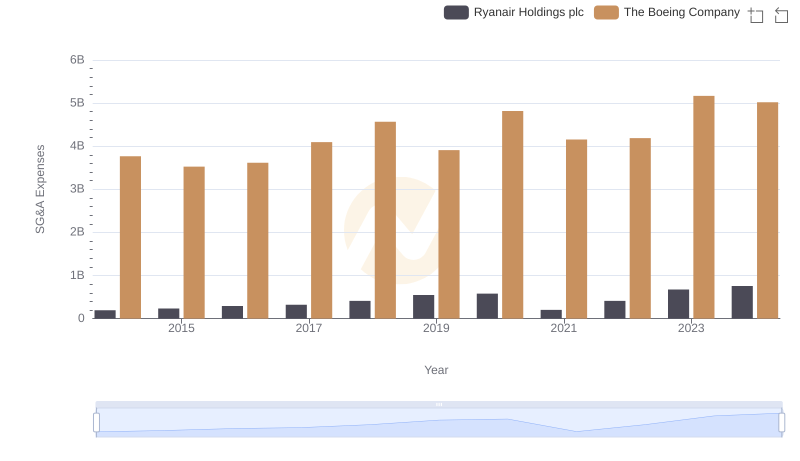
Breaking Down SG&A Expenses: The Boeing Company vs Ryanair Holdings plc
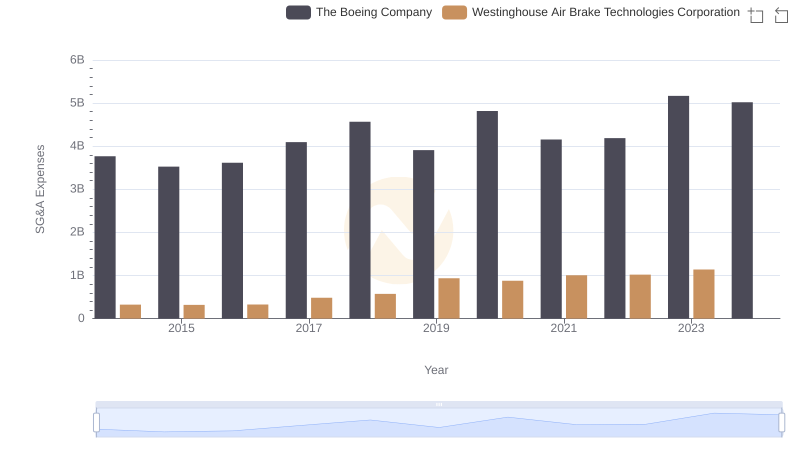
Who Optimizes SG&A Costs Better? The Boeing Company or Westinghouse Air Brake Technologies Corporation
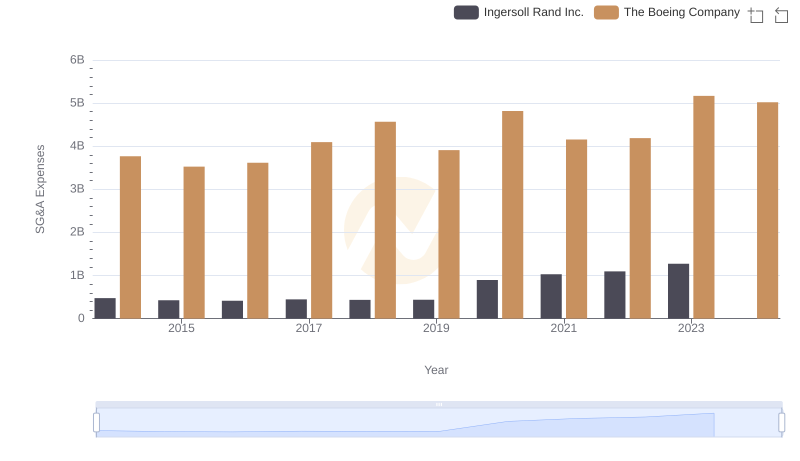
SG&A Efficiency Analysis: Comparing The Boeing Company and Ingersoll Rand Inc.
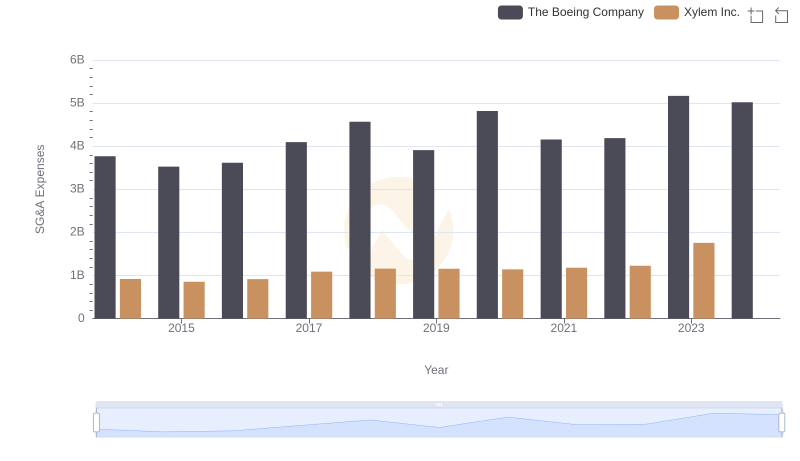
Who Optimizes SG&A Costs Better? The Boeing Company or Xylem Inc.