| __timestamp | Global Payments Inc. | The Boeing Company |
|---|---|---|
| Wednesday, January 1, 2014 | 1295014000 | 3767000000 |
| Thursday, January 1, 2015 | 1325567000 | 3525000000 |
| Friday, January 1, 2016 | 1411096000 | 3616000000 |
| Sunday, January 1, 2017 | 1488258000 | 4094000000 |
| Monday, January 1, 2018 | 1534297000 | 4567000000 |
| Tuesday, January 1, 2019 | 2046672000 | 3909000000 |
| Wednesday, January 1, 2020 | 2878878000 | 4817000000 |
| Friday, January 1, 2021 | 3391161000 | 4157000000 |
| Saturday, January 1, 2022 | 3524578000 | 4187000000 |
| Sunday, January 1, 2023 | 4073768000 | 5168000000 |
| Monday, January 1, 2024 | 4285307000 | 5021000000 |
Igniting the spark of knowledge
In the ever-evolving landscape of corporate finance, understanding the trends in Selling, General, and Administrative (SG&A) expenses is crucial. This analysis compares two industry titans: The Boeing Company and Global Payments Inc., from 2014 to 2023.
Boeing, a leader in aerospace, has seen its SG&A expenses grow by approximately 37% over the decade, peaking in 2023. This reflects its strategic investments in innovation and expansion, despite the challenges faced by the aviation industry.
Conversely, Global Payments Inc., a key player in the financial technology sector, experienced a staggering 214% increase in SG&A expenses. This surge underscores its aggressive growth strategy and adaptation to the digital economy.
While Boeing's expenses show a steady trajectory, Global Payments' rapid rise highlights the dynamic nature of fintech. Missing data for 2024 suggests ongoing developments worth monitoring.
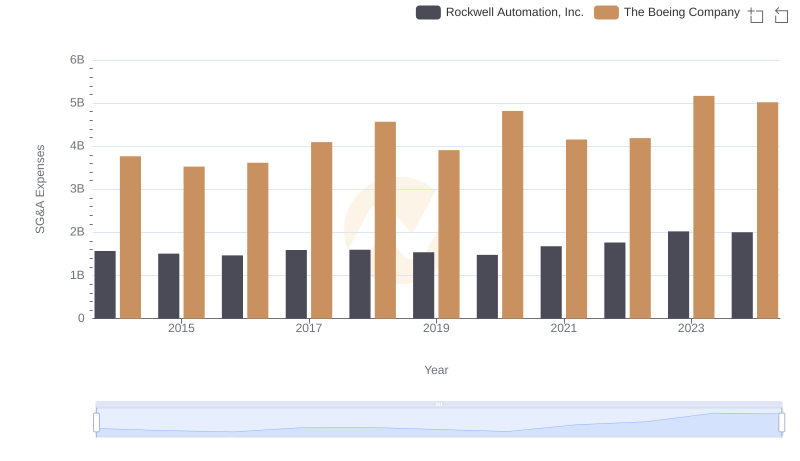
Who Optimizes SG&A Costs Better? The Boeing Company or Rockwell Automation, Inc.
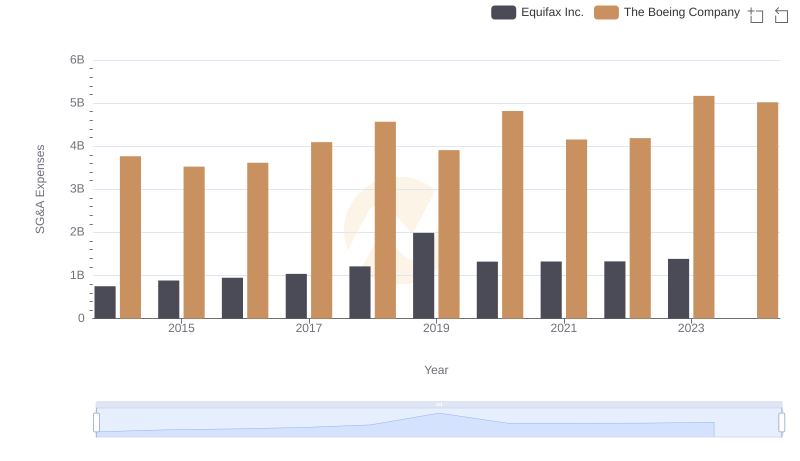
Comparing SG&A Expenses: The Boeing Company vs Equifax Inc. Trends and Insights
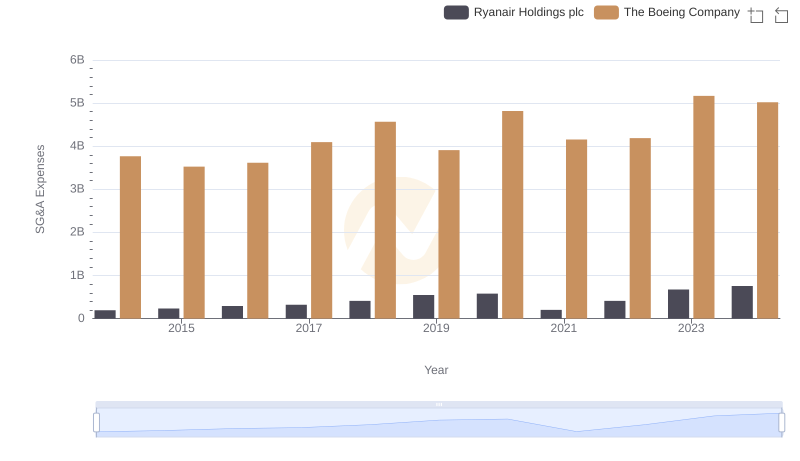
Breaking Down SG&A Expenses: The Boeing Company vs Ryanair Holdings plc
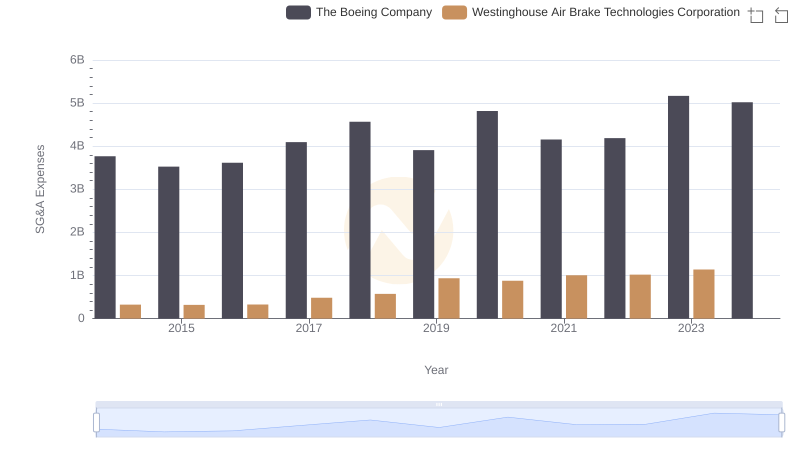
Who Optimizes SG&A Costs Better? The Boeing Company or Westinghouse Air Brake Technologies Corporation
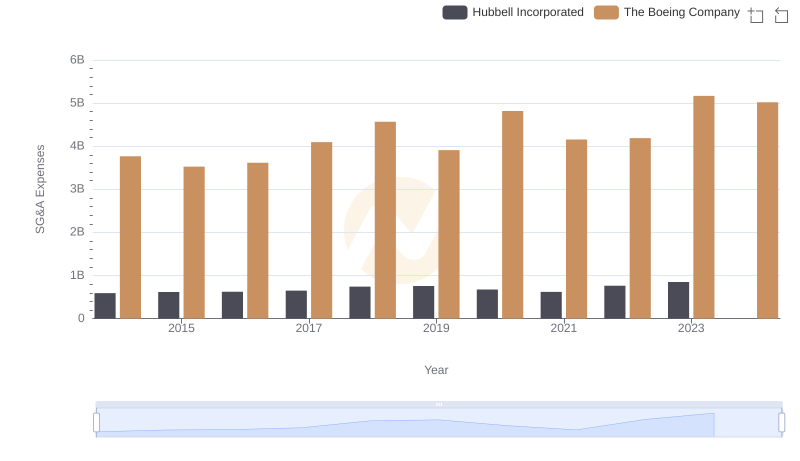
The Boeing Company vs Hubbell Incorporated: SG&A Expense Trends
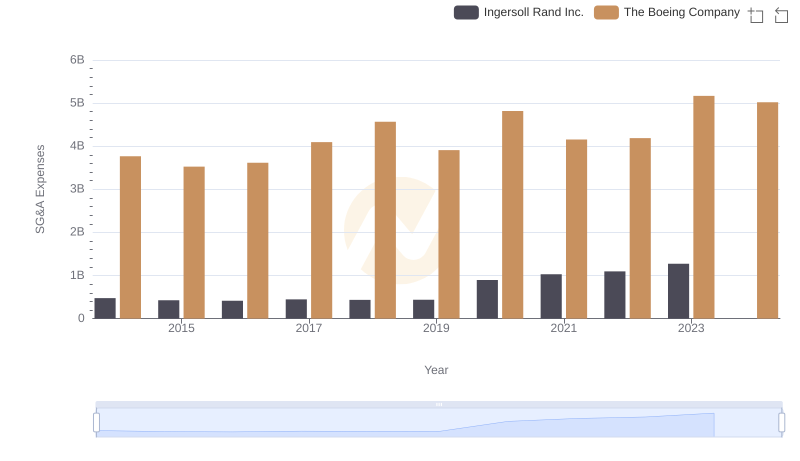
SG&A Efficiency Analysis: Comparing The Boeing Company and Ingersoll Rand Inc.