| __timestamp | Lennox International Inc. | The Boeing Company |
|---|---|---|
| Wednesday, January 1, 2014 | 3367400000 | 90762000000 |
| Thursday, January 1, 2015 | 3467400000 | 96114000000 |
| Friday, January 1, 2016 | 3641600000 | 94571000000 |
| Sunday, January 1, 2017 | 3839600000 | 93392000000 |
| Monday, January 1, 2018 | 3883900000 | 101127000000 |
| Tuesday, January 1, 2019 | 3807200000 | 76559000000 |
| Wednesday, January 1, 2020 | 3634100000 | 58158000000 |
| Friday, January 1, 2021 | 4194100000 | 62286000000 |
| Saturday, January 1, 2022 | 4718400000 | 66608000000 |
| Sunday, January 1, 2023 | 4981900000 | 77794000000 |
| Monday, January 1, 2024 | 5341300000 | 66517000000 |
Unleashing the power of data
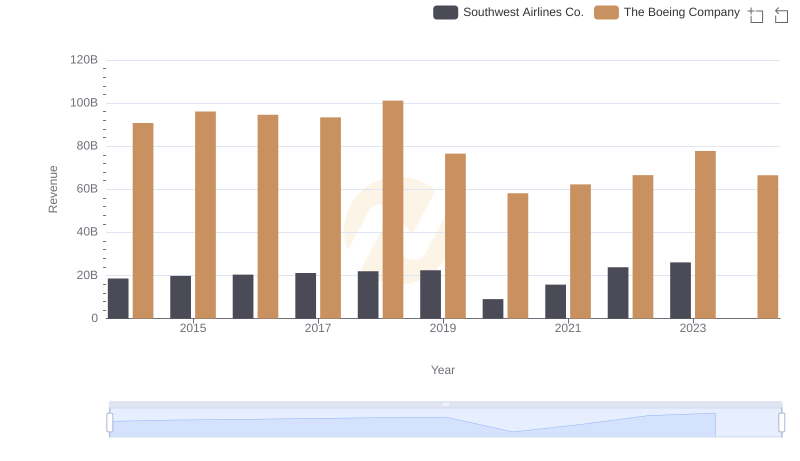
In the ever-evolving landscape of the aerospace and HVAC industries, understanding revenue trends is crucial. From 2014 to 2024, The Boeing Company and Lennox International Inc. have showcased distinct financial trajectories. Boeing, a titan in aerospace, saw its revenue peak in 2018, reaching approximately $101 billion, before experiencing a decline, notably during the pandemic years. By 2023, Boeing's revenue rebounded to around $78 billion, reflecting a recovery trend.
Conversely, Lennox International, a leader in climate control solutions, demonstrated consistent growth. Starting at $3.4 billion in 2014, Lennox's revenue steadily increased, reaching over $5.3 billion by 2024. This represents a robust growth of nearly 60% over the decade.
These trends highlight the resilience and adaptability of these companies in their respective sectors, offering valuable insights for investors and industry analysts alike.
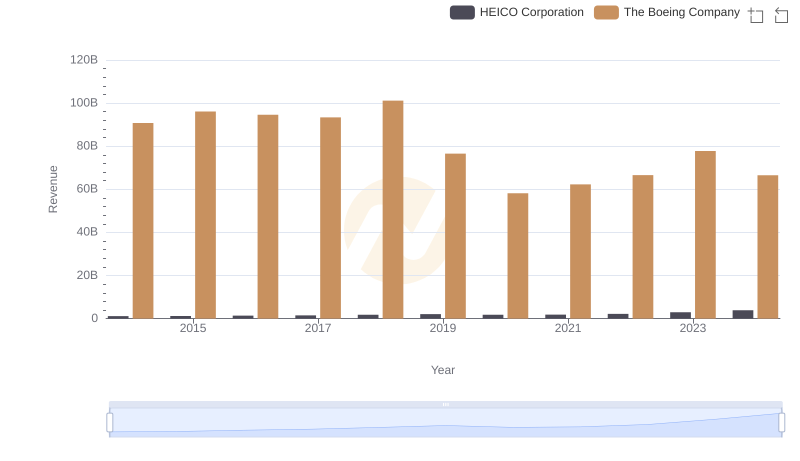
Revenue Showdown: The Boeing Company vs HEICO Corporation
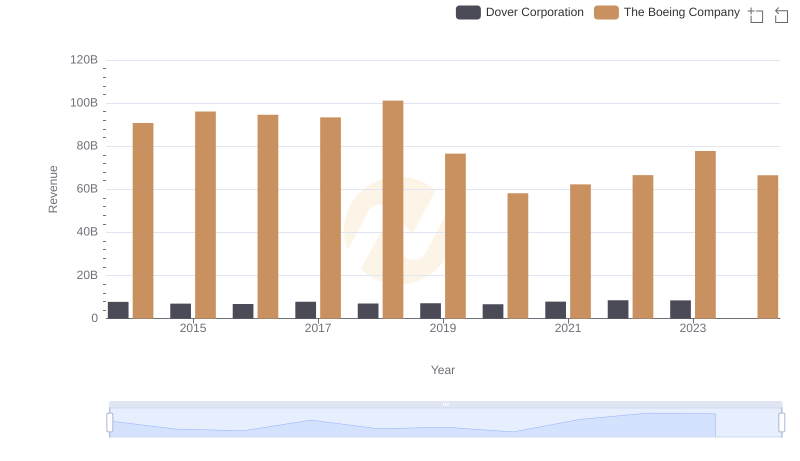
The Boeing Company and Dover Corporation: A Comprehensive Revenue Analysis
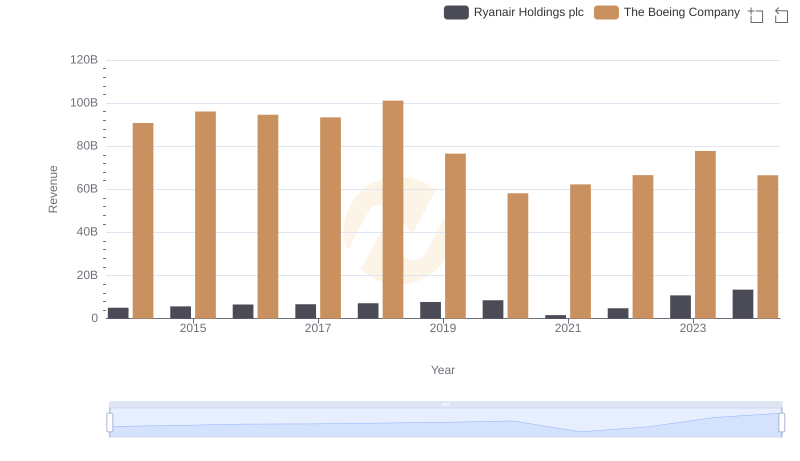
Who Generates More Revenue? The Boeing Company or Ryanair Holdings plc
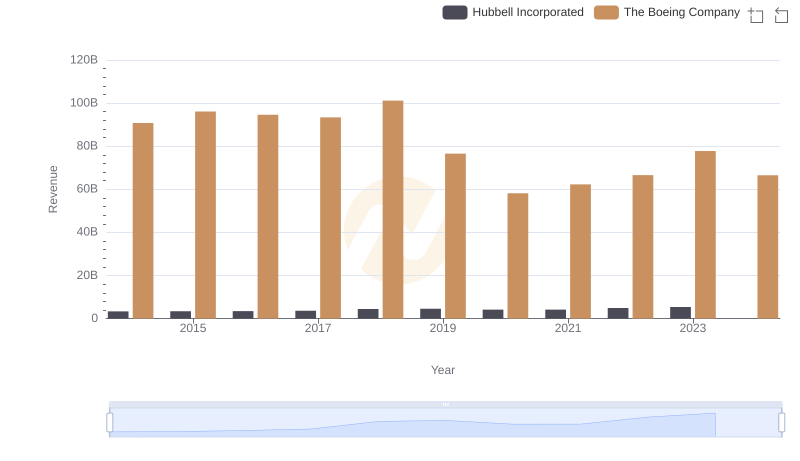
Who Generates More Revenue? The Boeing Company or Hubbell Incorporated
Who Generates More Revenue? The Boeing Company or Southwest Airlines Co.