| __timestamp | Manhattan Associates, Inc. | Synopsys, Inc. |
|---|---|---|
| Wednesday, January 1, 2014 | 492104000 | 2057472000 |
| Thursday, January 1, 2015 | 556371000 | 2242211000 |
| Friday, January 1, 2016 | 604557000 | 2422532000 |
| Sunday, January 1, 2017 | 594599000 | 2724880000 |
| Monday, January 1, 2018 | 559157000 | 3121058000 |
| Tuesday, January 1, 2019 | 617949000 | 3360694000 |
| Wednesday, January 1, 2020 | 586372000 | 3685281000 |
| Friday, January 1, 2021 | 663643000 | 4204193000 |
| Saturday, January 1, 2022 | 767084000 | 5081542000 |
| Sunday, January 1, 2023 | 928725000 | 5842619000 |
| Monday, January 1, 2024 | 1042352000 | 6127436000 |
Unveiling the hidden dimensions of data
In the ever-evolving landscape of technology and supply chain solutions, Synopsys, Inc. and Manhattan Associates, Inc. have carved distinct paths over the past decade. From 2014 to 2023, Synopsys, a leader in electronic design automation, has seen its revenue soar by nearly 184%, reflecting its pivotal role in the semiconductor industry. Meanwhile, Manhattan Associates, a key player in supply chain and omnichannel commerce, has experienced a commendable 89% growth in the same period.
Synopsys consistently outpaced Manhattan Associates, with its revenue peaking at approximately $5.8 billion in 2023. In contrast, Manhattan Associates reached around $928 million, showcasing its steady yet slower growth trajectory. The data highlights Synopsys's robust expansion, driven by the increasing demand for advanced chip design solutions, while Manhattan Associates continues to strengthen its position in the logistics and supply chain sector.
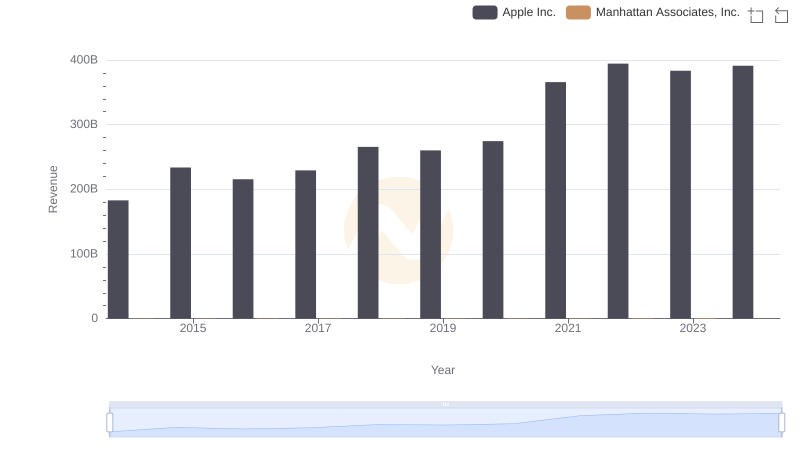
Breaking Down Revenue Trends: Apple Inc. vs Manhattan Associates, Inc.
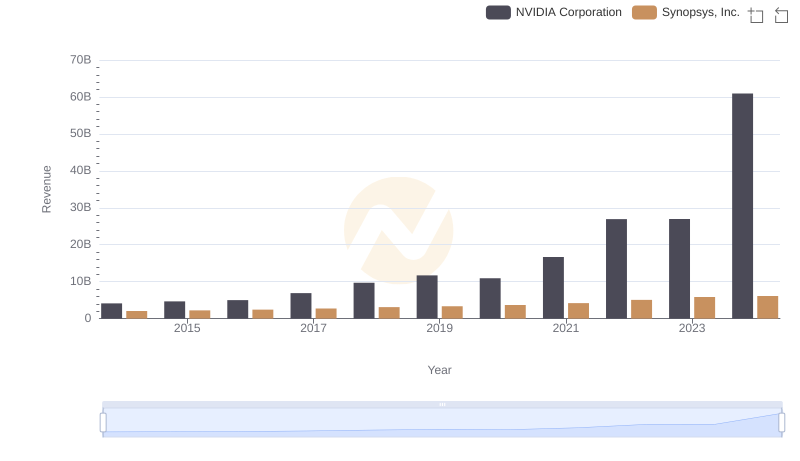
Who Generates More Revenue? NVIDIA Corporation or Synopsys, Inc.
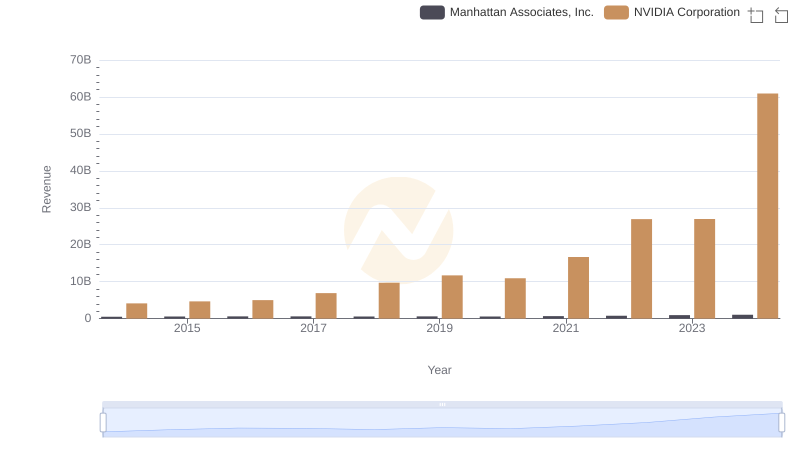
Revenue Showdown: NVIDIA Corporation vs Manhattan Associates, Inc.
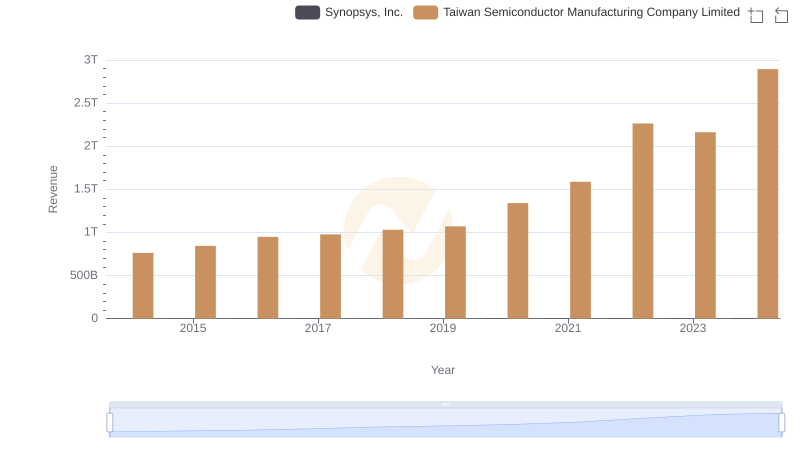
Taiwan Semiconductor Manufacturing Company Limited and Synopsys, Inc.: A Comprehensive Revenue Analysis
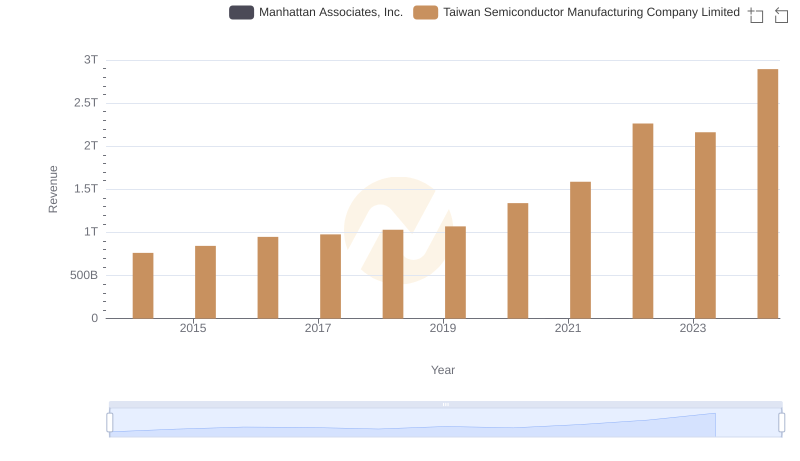
Breaking Down Revenue Trends: Taiwan Semiconductor Manufacturing Company Limited vs Manhattan Associates, Inc.
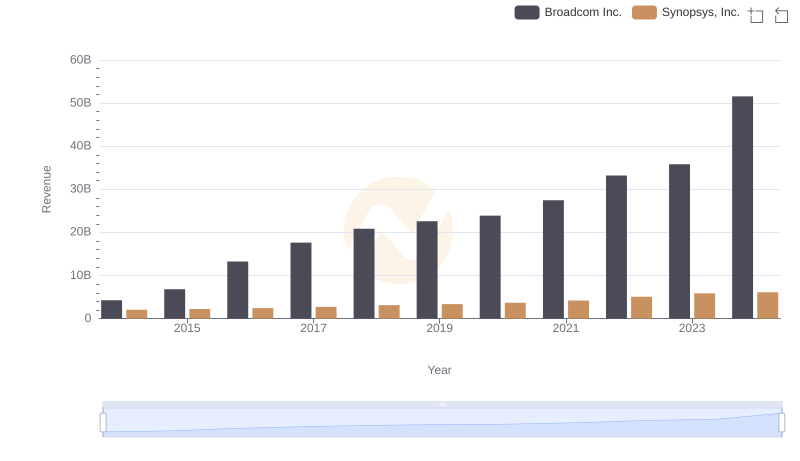
Revenue Insights: Broadcom Inc. and Synopsys, Inc. Performance Compared
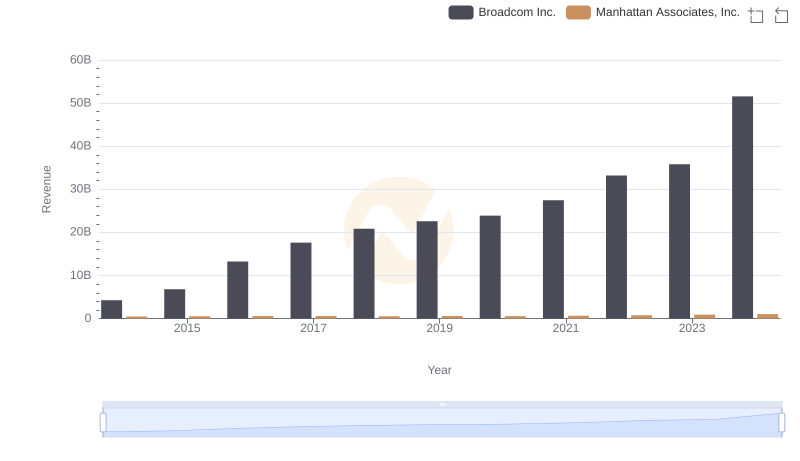
Broadcom Inc. or Manhattan Associates, Inc.: Who Leads in Yearly Revenue?
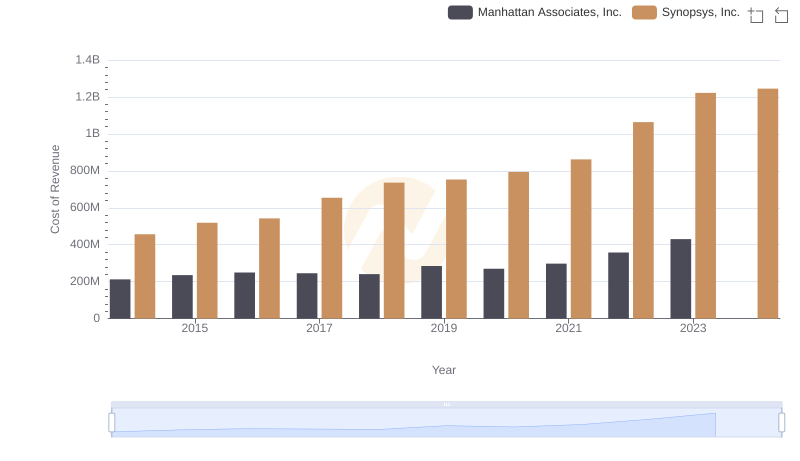
Cost of Revenue Trends: Synopsys, Inc. vs Manhattan Associates, Inc.

Gross Profit Analysis: Comparing Synopsys, Inc. and Manhattan Associates, Inc.
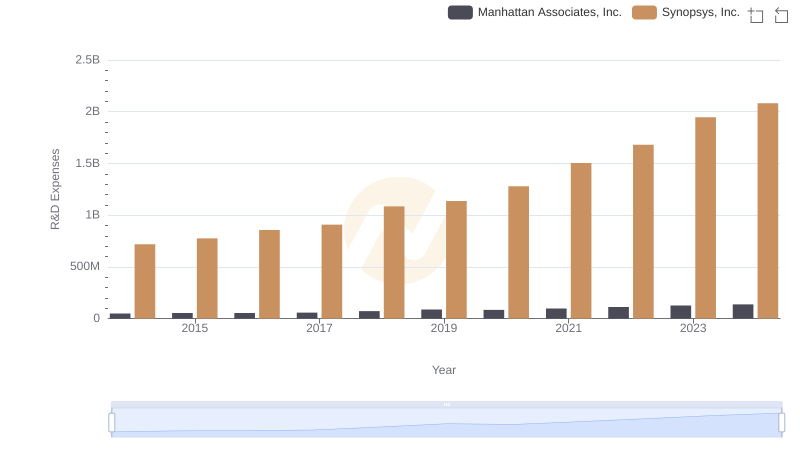
Synopsys, Inc. or Manhattan Associates, Inc.: Who Invests More in Innovation?
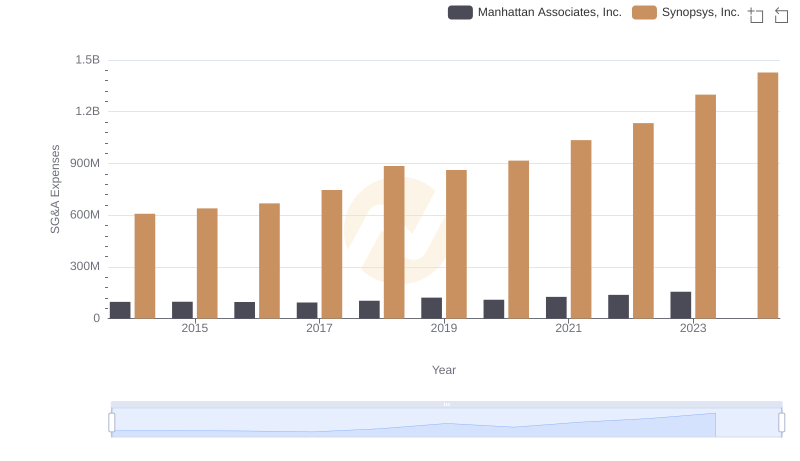
Synopsys, Inc. and Manhattan Associates, Inc.: SG&A Spending Patterns Compared
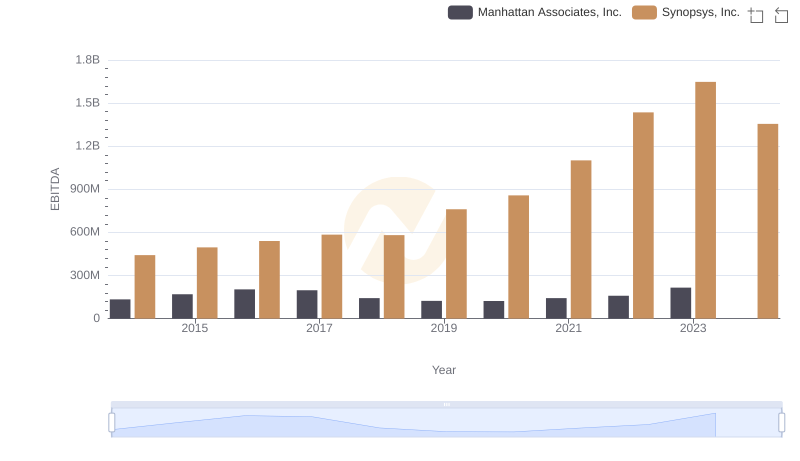
Comprehensive EBITDA Comparison: Synopsys, Inc. vs Manhattan Associates, Inc.