| __timestamp | Manhattan Associates, Inc. | Synopsys, Inc. |
|---|---|---|
| Wednesday, January 1, 2014 | 97072000 | 608294000 |
| Thursday, January 1, 2015 | 97874000 | 639504000 |
| Friday, January 1, 2016 | 96545000 | 668330000 |
| Sunday, January 1, 2017 | 93536000 | 746092000 |
| Monday, January 1, 2018 | 103880000 | 885538000 |
| Tuesday, January 1, 2019 | 121463000 | 862108000 |
| Wednesday, January 1, 2020 | 109202000 | 916540000 |
| Friday, January 1, 2021 | 125941000 | 1035479000 |
| Saturday, January 1, 2022 | 137607000 | 1133617000 |
| Sunday, January 1, 2023 | 155664000 | 1299327000 |
| Monday, January 1, 2024 | 165786000 | 1427838000 |
Unveiling the hidden dimensions of data
In the ever-evolving landscape of corporate finance, understanding the spending patterns of industry leaders can offer valuable insights. Over the past decade, Synopsys, Inc. and Manhattan Associates, Inc. have demonstrated distinct trajectories in their Selling, General, and Administrative (SG&A) expenses.
From 2014 to 2023, Synopsys, Inc. has seen a consistent increase in SG&A expenses, growing by approximately 113%. This upward trend reflects the company's strategic investments in expanding its market presence and enhancing operational efficiencies.
Conversely, Manhattan Associates, Inc. has experienced a more modest increase of around 60% in the same period. This growth, while steady, suggests a more conservative approach to scaling operations.
As we look to 2024, Synopsys continues its upward trajectory, while data for Manhattan Associates remains elusive, hinting at potential strategic shifts.
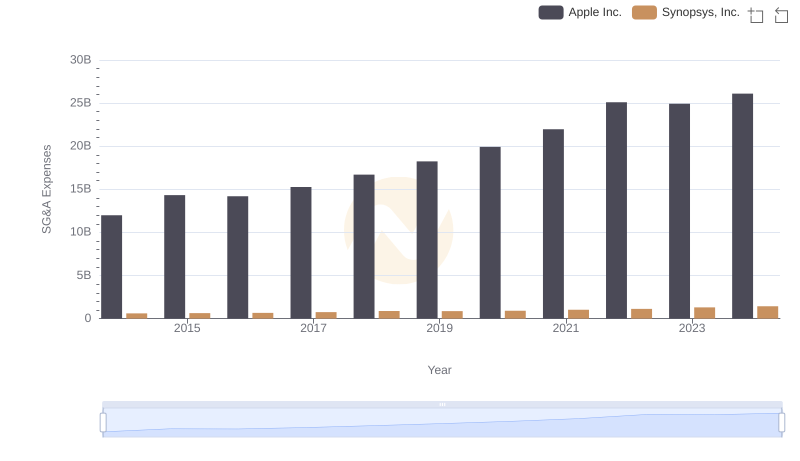
Cost Management Insights: SG&A Expenses for Apple Inc. and Synopsys, Inc.
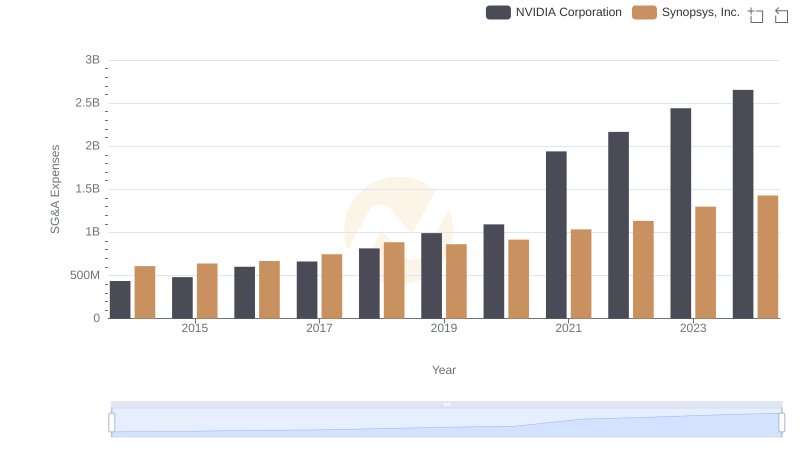
Cost Management Insights: SG&A Expenses for NVIDIA Corporation and Synopsys, Inc.
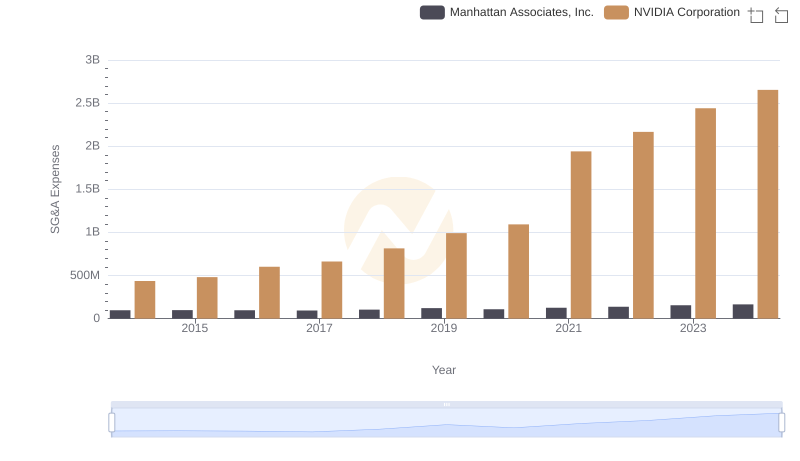
Who Optimizes SG&A Costs Better? NVIDIA Corporation or Manhattan Associates, Inc.
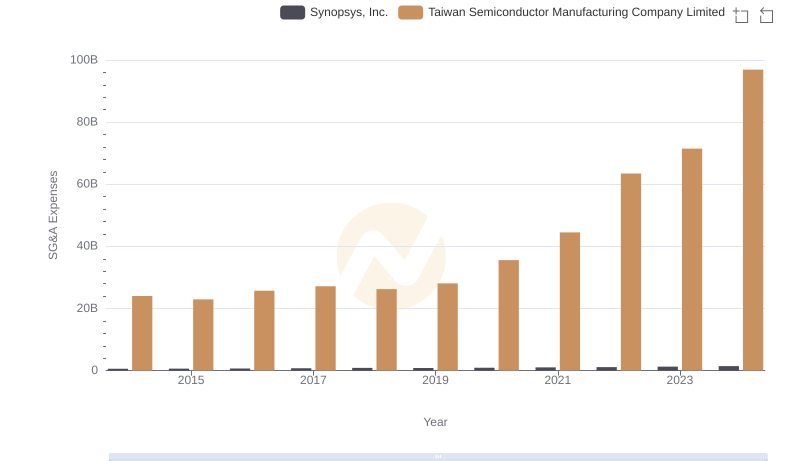
Operational Costs Compared: SG&A Analysis of Taiwan Semiconductor Manufacturing Company Limited and Synopsys, Inc.
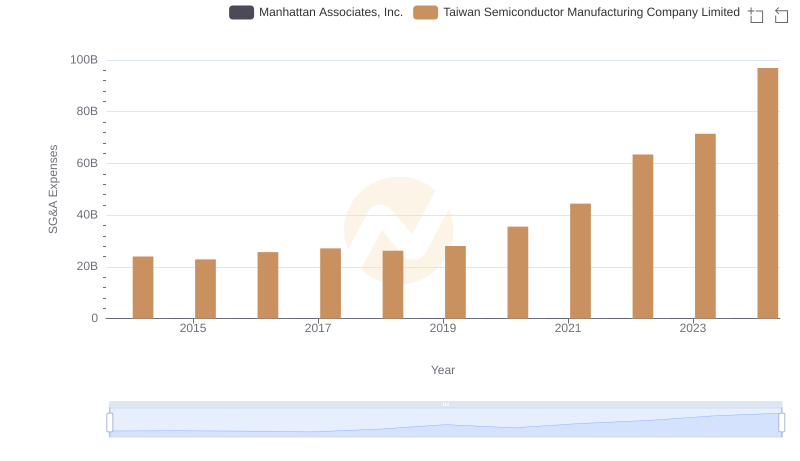
Who Optimizes SG&A Costs Better? Taiwan Semiconductor Manufacturing Company Limited or Manhattan Associates, Inc.
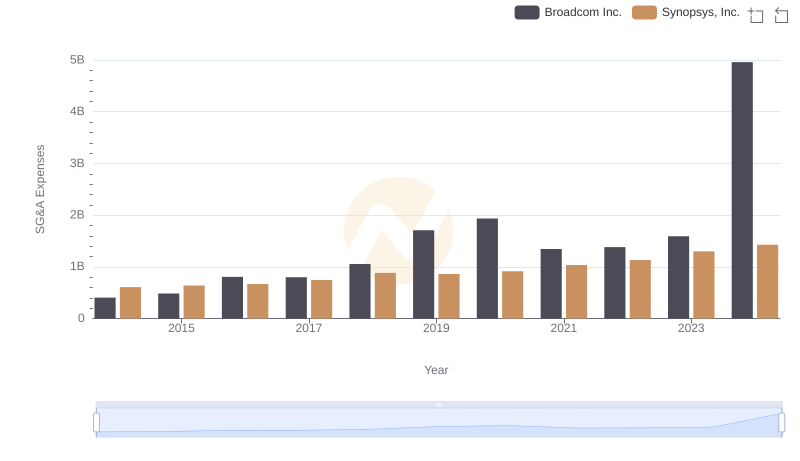
SG&A Efficiency Analysis: Comparing Broadcom Inc. and Synopsys, Inc.
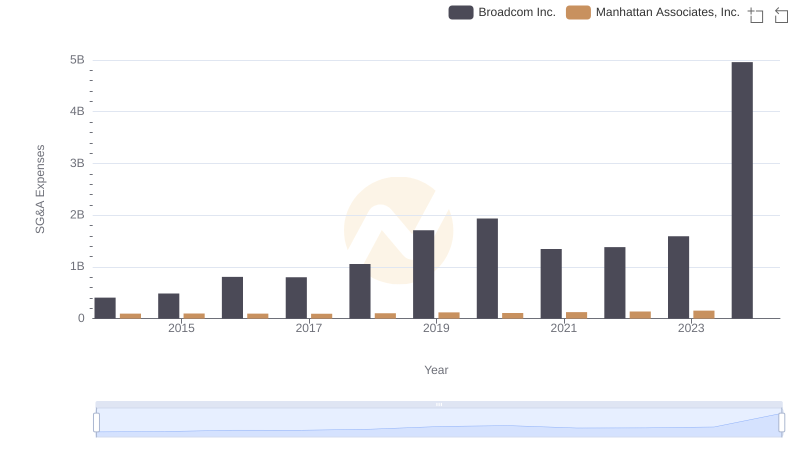
Comparing SG&A Expenses: Broadcom Inc. vs Manhattan Associates, Inc. Trends and Insights

Synopsys, Inc. vs Manhattan Associates, Inc.: Annual Revenue Growth Compared
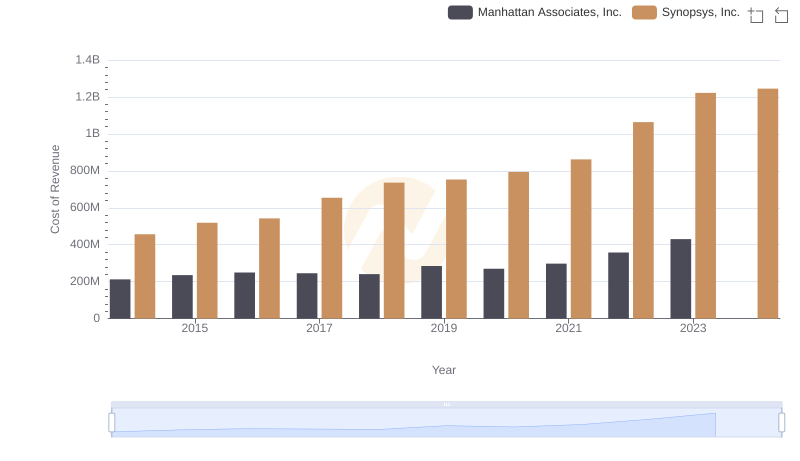
Cost of Revenue Trends: Synopsys, Inc. vs Manhattan Associates, Inc.

Gross Profit Analysis: Comparing Synopsys, Inc. and Manhattan Associates, Inc.
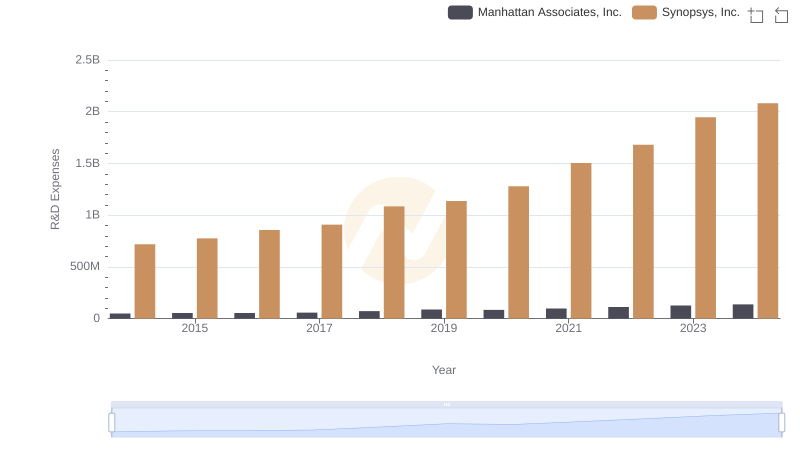
Synopsys, Inc. or Manhattan Associates, Inc.: Who Invests More in Innovation?
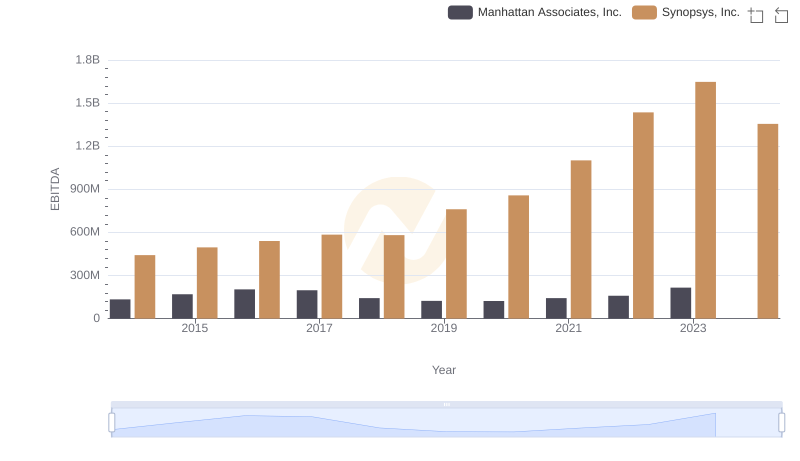
Comprehensive EBITDA Comparison: Synopsys, Inc. vs Manhattan Associates, Inc.