| __timestamp | Manhattan Associates, Inc. | Synopsys, Inc. |
|---|---|---|
| Wednesday, January 1, 2014 | 279526000 | 1600587000 |
| Thursday, January 1, 2015 | 320943000 | 1723291000 |
| Friday, January 1, 2016 | 354678000 | 1879570000 |
| Sunday, January 1, 2017 | 348866000 | 2070696000 |
| Monday, January 1, 2018 | 318276000 | 2385160000 |
| Tuesday, January 1, 2019 | 332982000 | 2607748000 |
| Wednesday, January 1, 2020 | 316485000 | 2890591000 |
| Friday, January 1, 2021 | 365816000 | 3342416000 |
| Saturday, January 1, 2022 | 408847000 | 4017845000 |
| Sunday, January 1, 2023 | 498111000 | 4620426000 |
| Monday, January 1, 2024 | 571372000 | 4882147000 |
Unleashing insights
In the ever-evolving landscape of technology, financial performance is a key indicator of a company's success. Over the past decade, Synopsys, Inc. and Manhattan Associates, Inc. have demonstrated remarkable growth in their gross profits. From 2014 to 2023, Synopsys has seen its gross profit soar by approximately 189%, reaching a peak of $4.62 billion in 2023. This growth underscores Synopsys' robust market position and strategic advancements in the semiconductor industry.
Conversely, Manhattan Associates, a leader in supply chain solutions, has experienced a more modest yet significant increase of around 78% in the same period, culminating in a gross profit of $498 million in 2023. This growth trajectory highlights Manhattan's resilience and adaptability in a competitive market. As we look to the future, these trends offer valuable insights into the financial health and strategic direction of these industry giants.
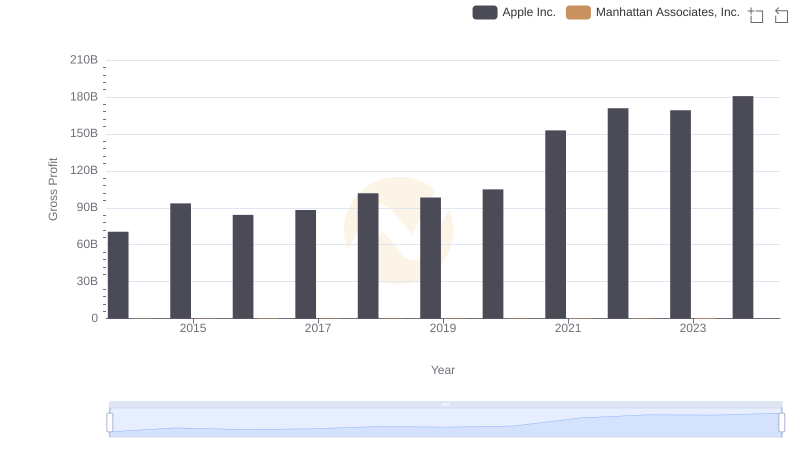
Apple Inc. and Manhattan Associates, Inc.: A Detailed Gross Profit Analysis
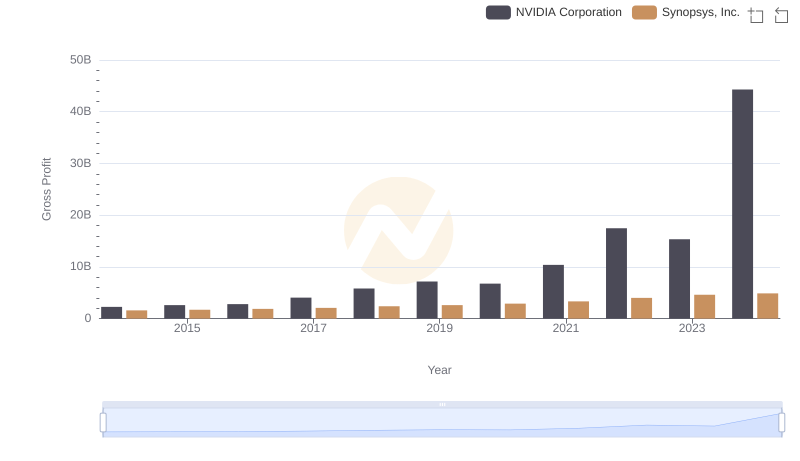
NVIDIA Corporation vs Synopsys, Inc.: A Gross Profit Performance Breakdown
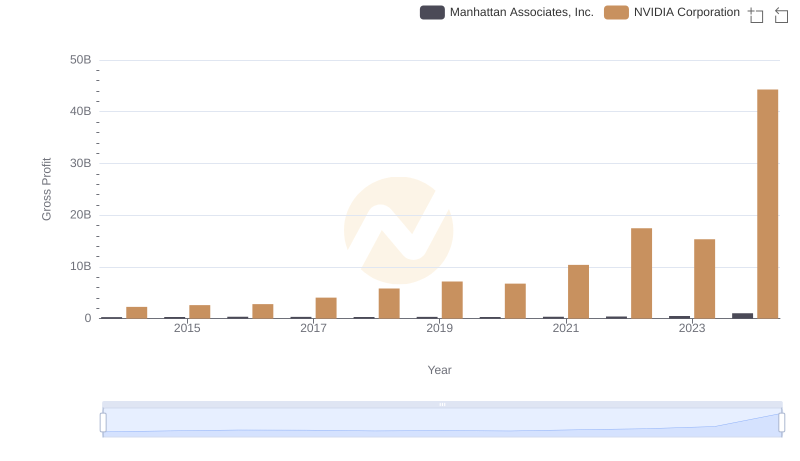
NVIDIA Corporation and Manhattan Associates, Inc.: A Detailed Gross Profit Analysis
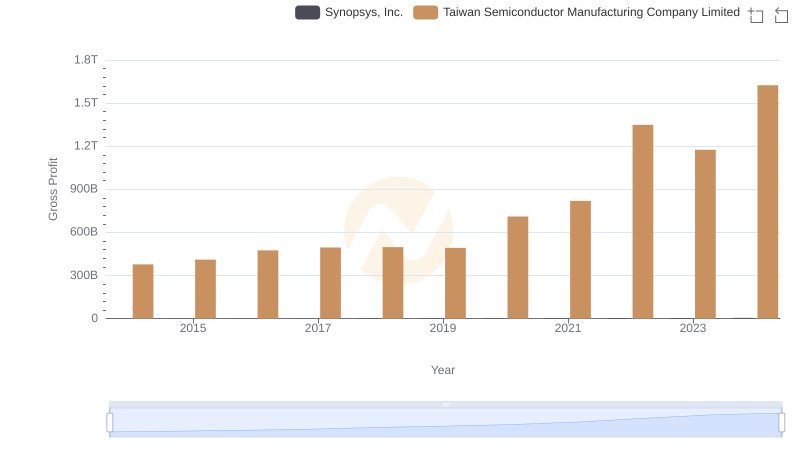
Gross Profit Comparison: Taiwan Semiconductor Manufacturing Company Limited and Synopsys, Inc. Trends

Key Insights on Gross Profit: Taiwan Semiconductor Manufacturing Company Limited vs Manhattan Associates, Inc.
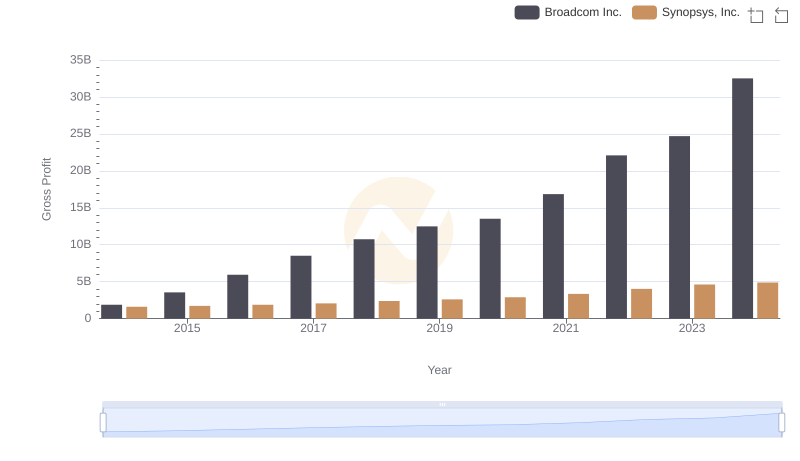
Broadcom Inc. vs Synopsys, Inc.: A Gross Profit Performance Breakdown
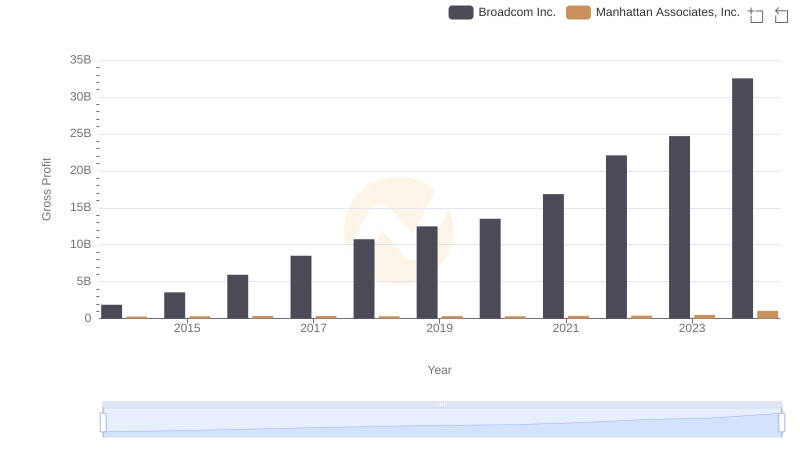
Broadcom Inc. vs Manhattan Associates, Inc.: A Gross Profit Performance Breakdown

Synopsys, Inc. vs Manhattan Associates, Inc.: Annual Revenue Growth Compared
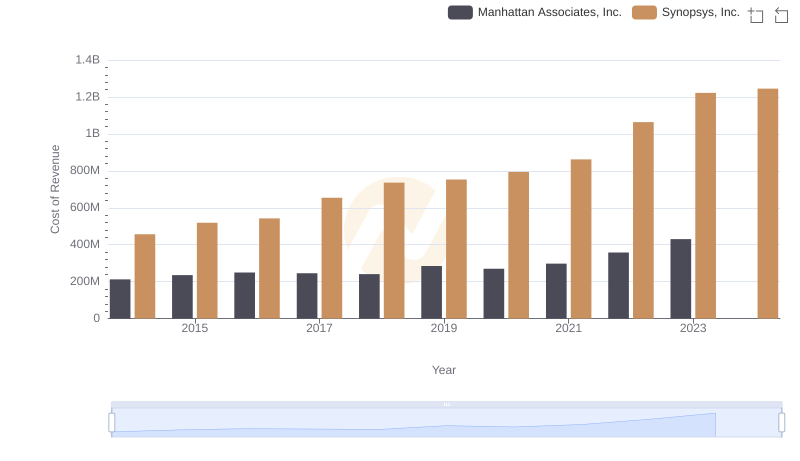
Cost of Revenue Trends: Synopsys, Inc. vs Manhattan Associates, Inc.
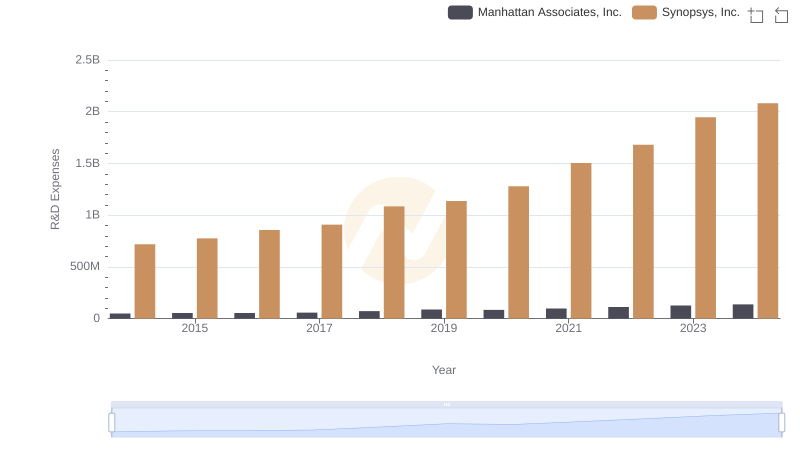
Synopsys, Inc. or Manhattan Associates, Inc.: Who Invests More in Innovation?
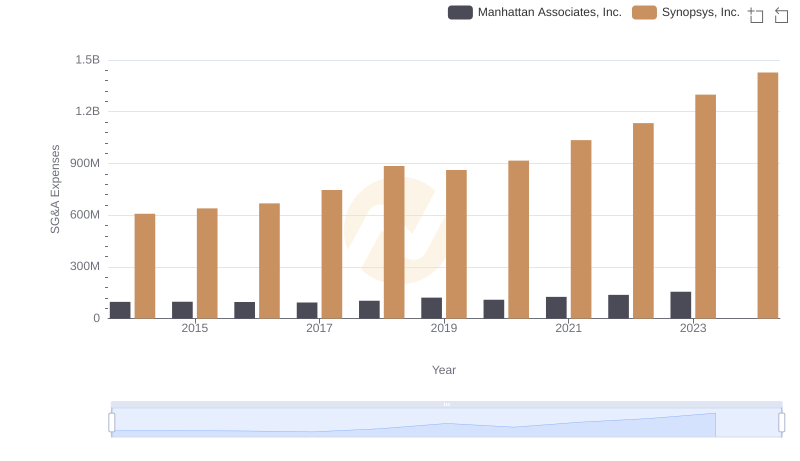
Synopsys, Inc. and Manhattan Associates, Inc.: SG&A Spending Patterns Compared
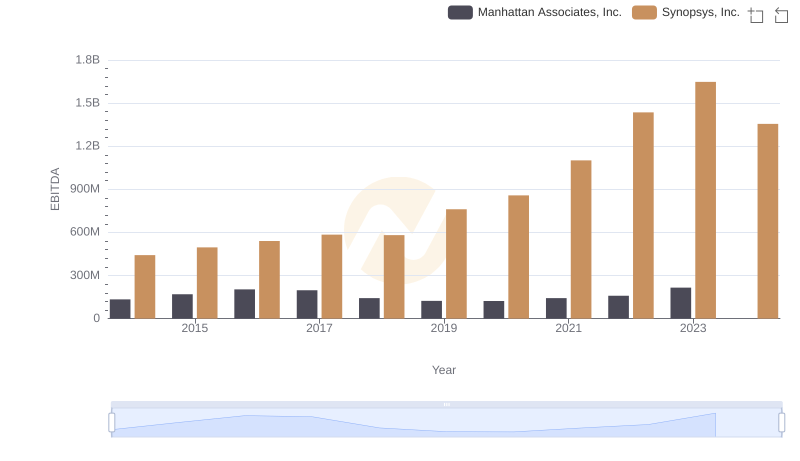
Comprehensive EBITDA Comparison: Synopsys, Inc. vs Manhattan Associates, Inc.