| __timestamp | Manhattan Associates, Inc. | Synopsys, Inc. |
|---|---|---|
| Wednesday, January 1, 2014 | 212578000 | 456885000 |
| Thursday, January 1, 2015 | 235428000 | 518920000 |
| Friday, January 1, 2016 | 249879000 | 542962000 |
| Sunday, January 1, 2017 | 245733000 | 654184000 |
| Monday, January 1, 2018 | 240881000 | 735898000 |
| Tuesday, January 1, 2019 | 284967000 | 752946000 |
| Wednesday, January 1, 2020 | 269887000 | 794690000 |
| Friday, January 1, 2021 | 297827000 | 861777000 |
| Saturday, January 1, 2022 | 358237000 | 1063697000 |
| Sunday, January 1, 2023 | 430614000 | 1222193000 |
| Monday, January 1, 2024 | 470980000 | 1245289000 |
Unlocking the unknown
In the ever-evolving landscape of technology, understanding cost dynamics is crucial. Over the past decade, Synopsys, Inc. and Manhattan Associates, Inc. have showcased intriguing trends in their cost of revenue. From 2014 to 2023, Synopsys, Inc. has seen a remarkable 167% increase in its cost of revenue, reflecting its aggressive growth and expansion strategies. In contrast, Manhattan Associates, Inc. experienced a 102% rise, indicating a more measured approach.
Synopsys, Inc. consistently outpaced its counterpart, with its cost of revenue peaking at over $1.2 billion in 2023. This growth underscores its commitment to innovation and market leadership.
While Manhattan Associates, Inc. has shown a steady increase, reaching approximately $430 million in 2023, its strategy appears more conservative, focusing on sustainable growth.
These trends highlight the diverse strategies employed by tech giants in navigating the competitive landscape.
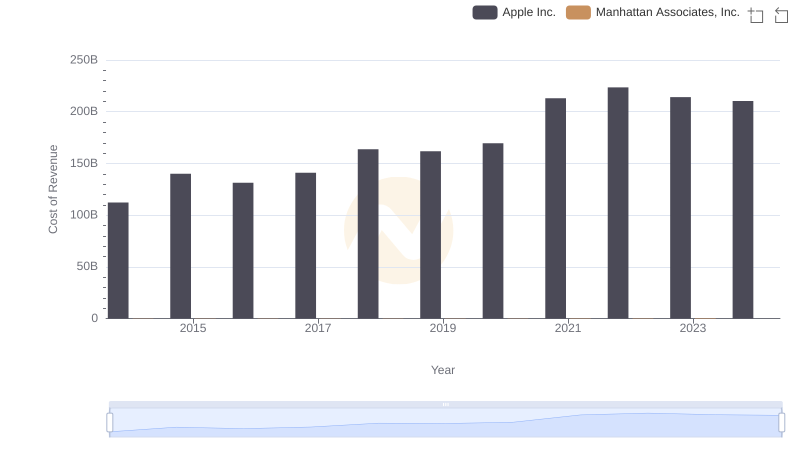
Comparing Cost of Revenue Efficiency: Apple Inc. vs Manhattan Associates, Inc.
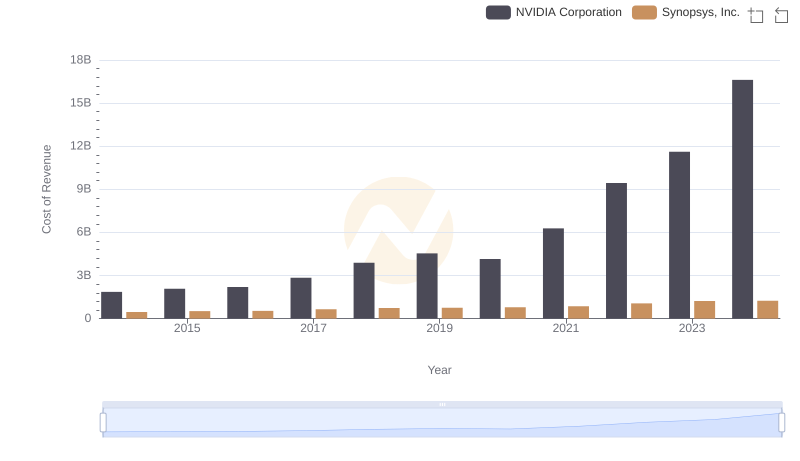
Cost of Revenue Comparison: NVIDIA Corporation vs Synopsys, Inc.
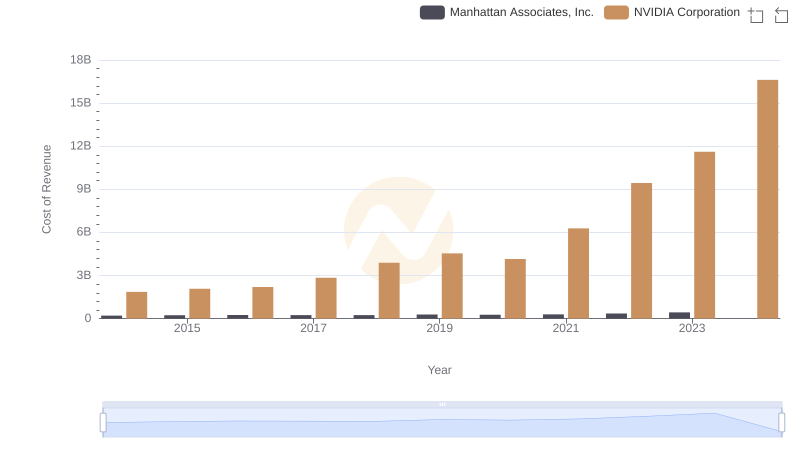
Cost of Revenue Comparison: NVIDIA Corporation vs Manhattan Associates, Inc.
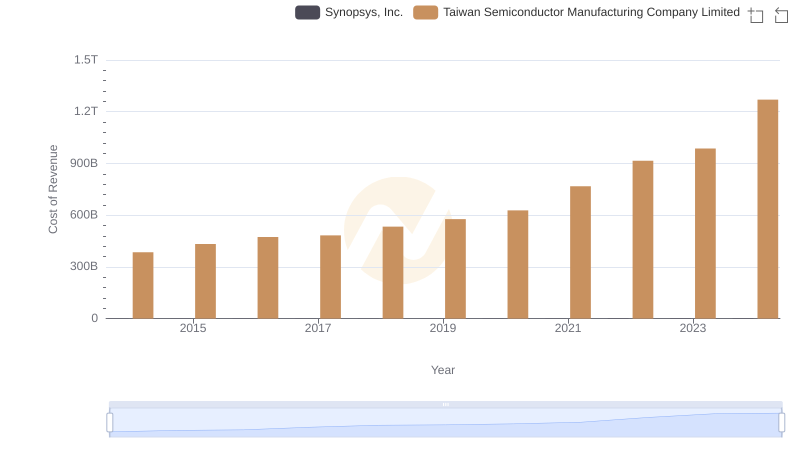
Cost of Revenue Trends: Taiwan Semiconductor Manufacturing Company Limited vs Synopsys, Inc.
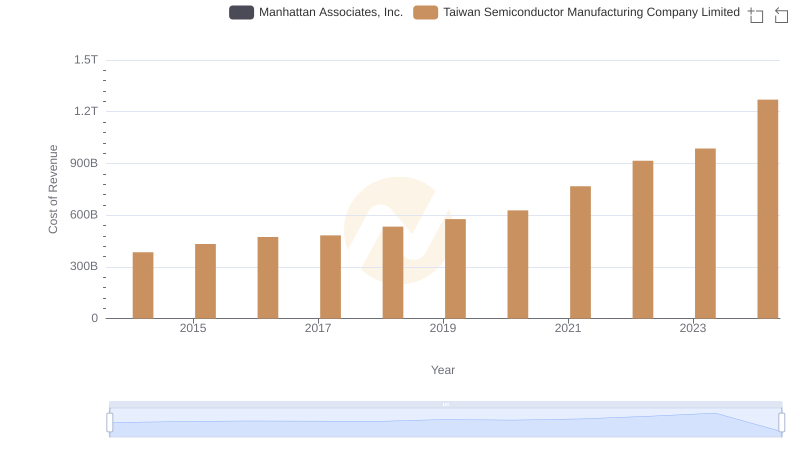
Cost of Revenue Trends: Taiwan Semiconductor Manufacturing Company Limited vs Manhattan Associates, Inc.
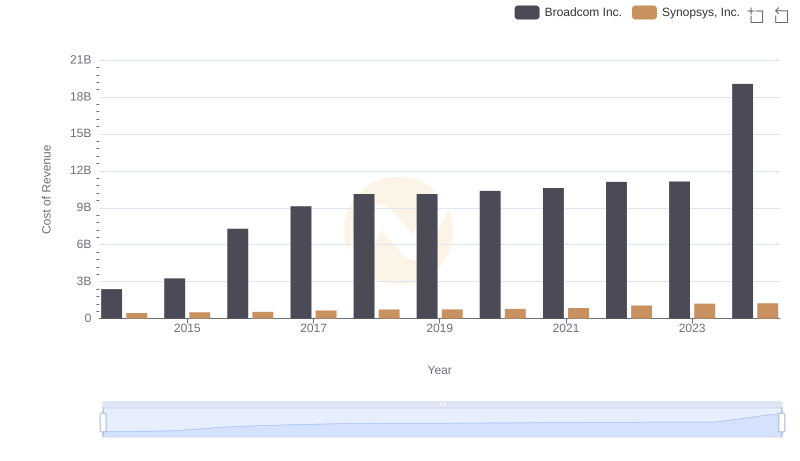
Cost of Revenue Trends: Broadcom Inc. vs Synopsys, Inc.
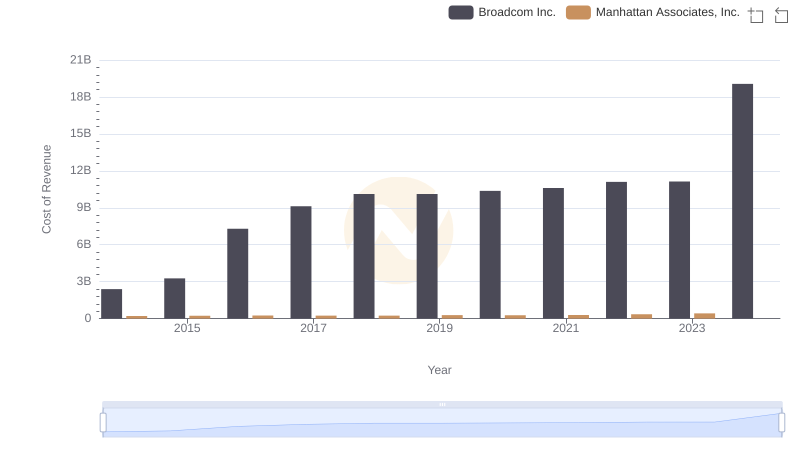
Cost of Revenue Trends: Broadcom Inc. vs Manhattan Associates, Inc.

Synopsys, Inc. vs Manhattan Associates, Inc.: Annual Revenue Growth Compared

Gross Profit Analysis: Comparing Synopsys, Inc. and Manhattan Associates, Inc.
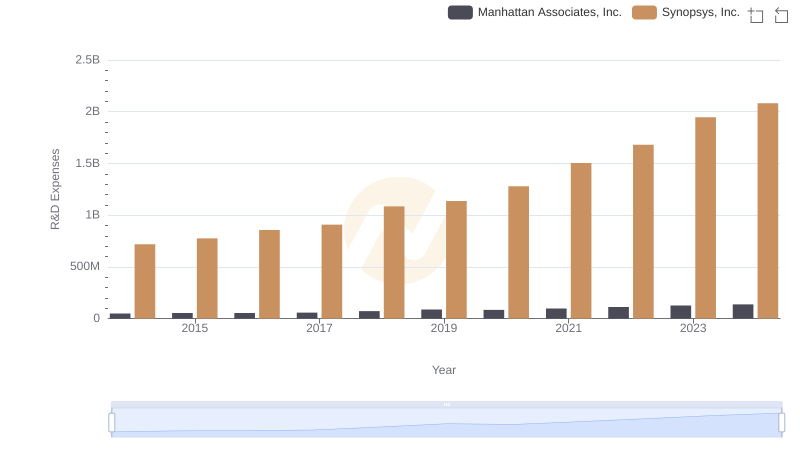
Synopsys, Inc. or Manhattan Associates, Inc.: Who Invests More in Innovation?
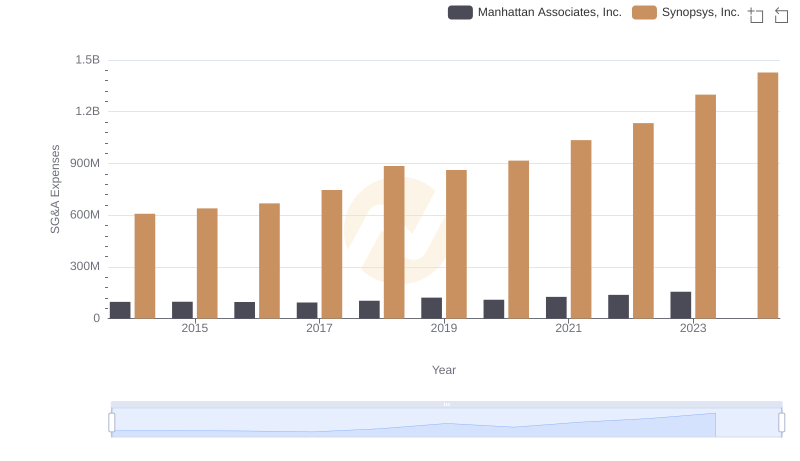
Synopsys, Inc. and Manhattan Associates, Inc.: SG&A Spending Patterns Compared
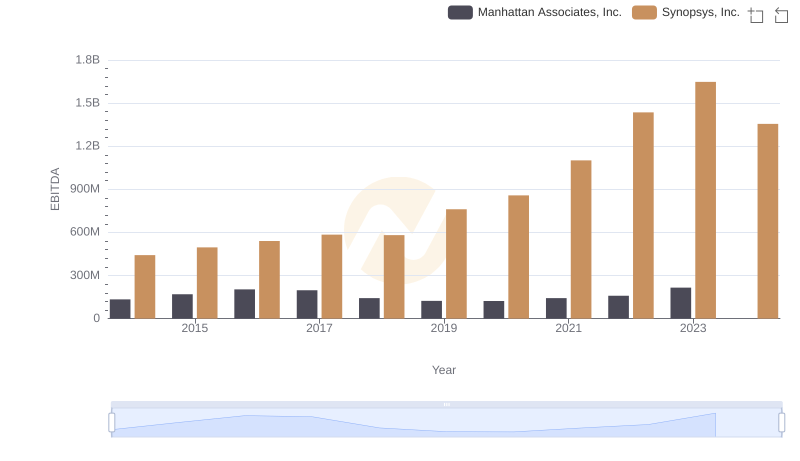
Comprehensive EBITDA Comparison: Synopsys, Inc. vs Manhattan Associates, Inc.