| __timestamp | Splunk Inc. | Teledyne Technologies Incorporated |
|---|---|---|
| Wednesday, January 1, 2014 | 269210000 | 612400000 |
| Thursday, January 1, 2015 | 447517000 | 588600000 |
| Friday, January 1, 2016 | 626927000 | 574100000 |
| Sunday, January 1, 2017 | 806883000 | 656000000 |
| Monday, January 1, 2018 | 967560000 | 694200000 |
| Tuesday, January 1, 2019 | 1267538000 | 751600000 |
| Wednesday, January 1, 2020 | 1596475000 | 700800000 |
| Friday, January 1, 2021 | 1671200000 | 1067800000 |
| Saturday, January 1, 2022 | 2056950000 | 1156600000 |
| Sunday, January 1, 2023 | 2076049000 | 1208300000 |
| Monday, January 1, 2024 | 2074630000 |
Unleashing insights
In the ever-evolving landscape of technology and innovation, understanding the financial strategies of industry leaders is crucial. Splunk Inc. and Teledyne Technologies Incorporated, two giants in their respective fields, have shown distinct patterns in their Selling, General, and Administrative (SG&A) expenses over the past decade.
From 2014 to 2023, Splunk Inc. has seen a remarkable increase in SG&A spending, growing by approximately 670%. This surge reflects their aggressive expansion and investment in market presence. In contrast, Teledyne Technologies Incorporated has maintained a more conservative growth, with a 97% increase over the same period.
Interestingly, while Splunk's SG&A expenses peaked in 2023, Teledyne's data for 2024 remains elusive, leaving room for speculation on their future financial strategies. These trends offer a fascinating glimpse into how different companies allocate resources to drive growth and maintain competitiveness.
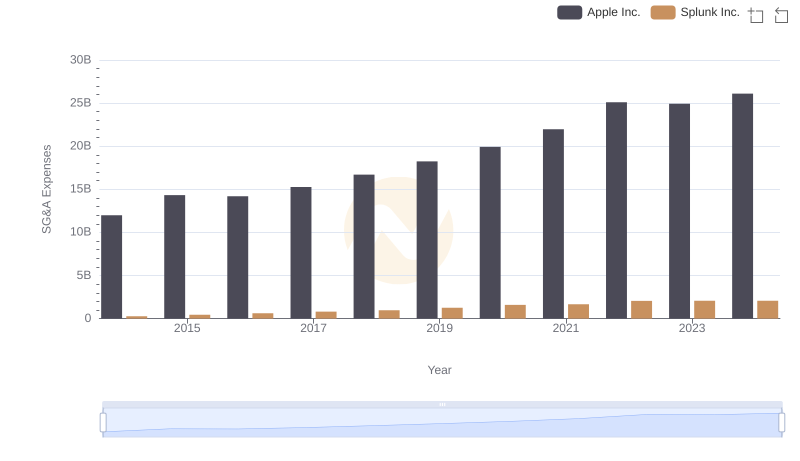
Operational Costs Compared: SG&A Analysis of Apple Inc. and Splunk Inc.
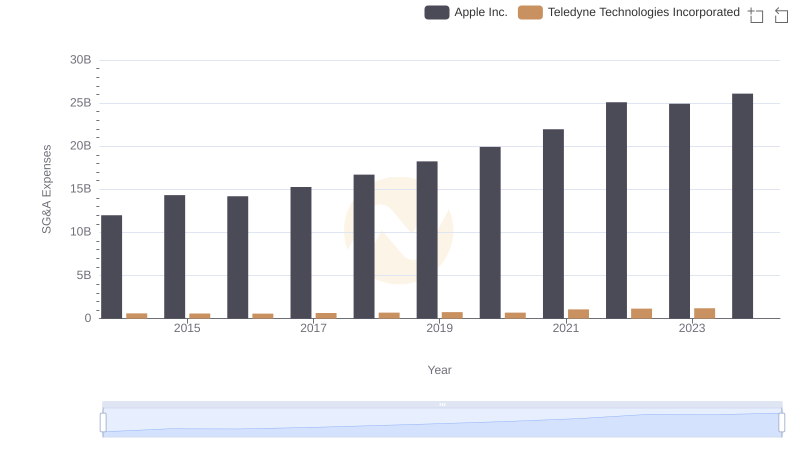
Breaking Down SG&A Expenses: Apple Inc. vs Teledyne Technologies Incorporated
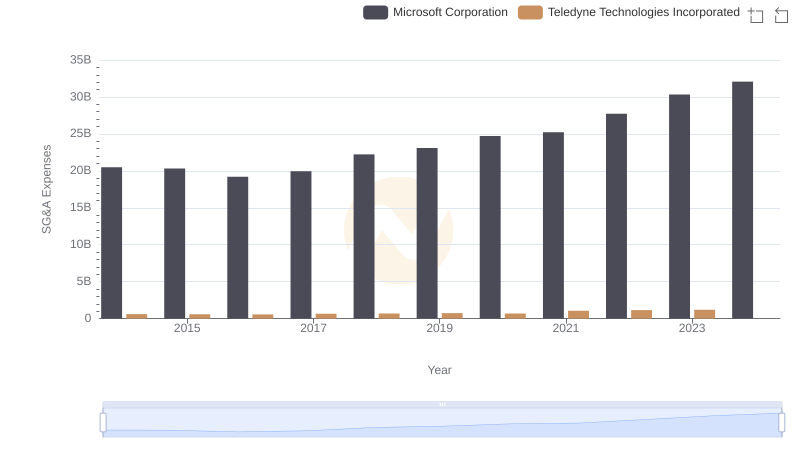
SG&A Efficiency Analysis: Comparing Microsoft Corporation and Teledyne Technologies Incorporated
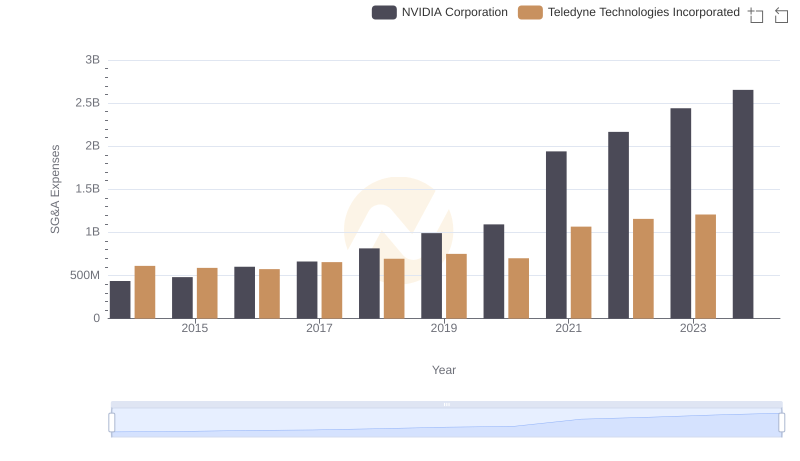
NVIDIA Corporation and Teledyne Technologies Incorporated: SG&A Spending Patterns Compared
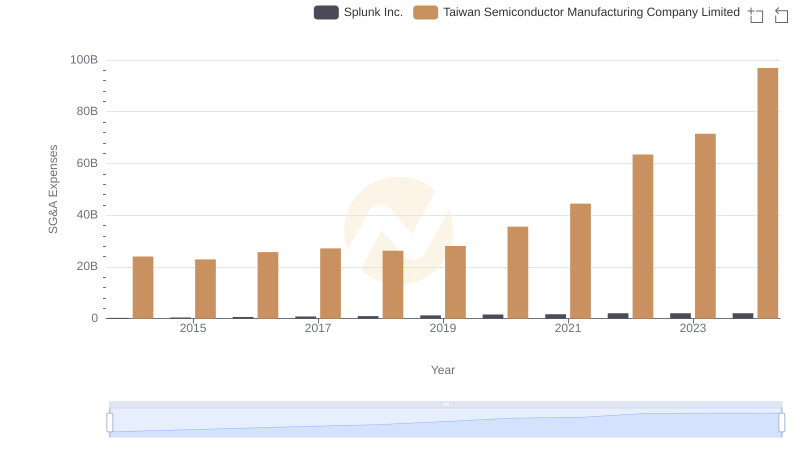
Operational Costs Compared: SG&A Analysis of Taiwan Semiconductor Manufacturing Company Limited and Splunk Inc.
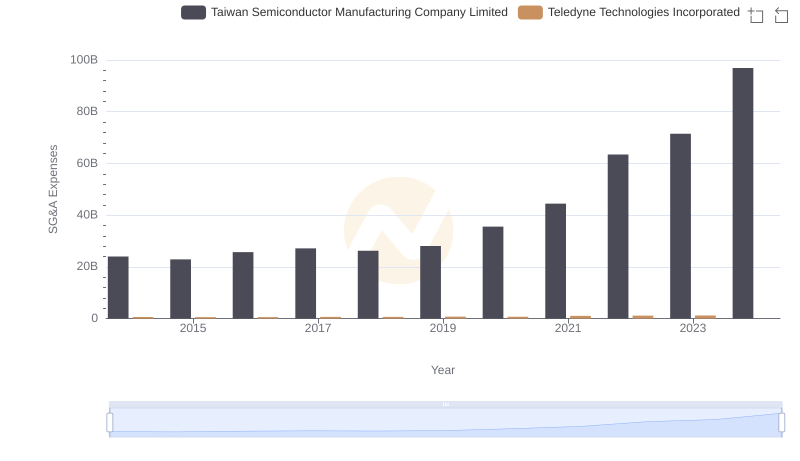
Selling, General, and Administrative Costs: Taiwan Semiconductor Manufacturing Company Limited vs Teledyne Technologies Incorporated
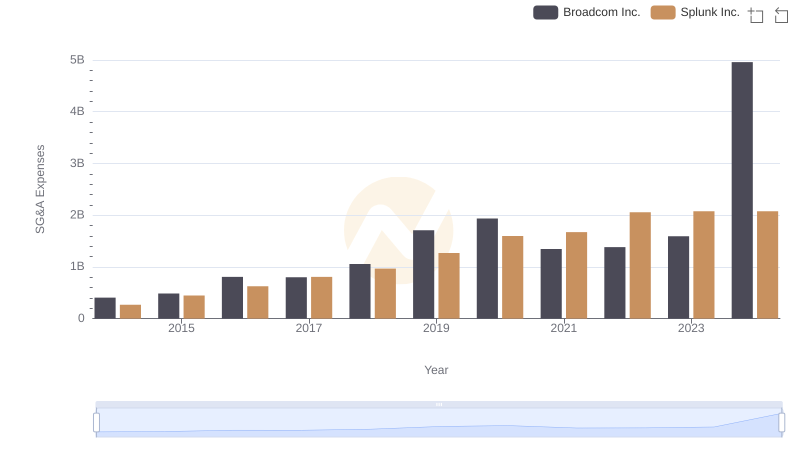
Breaking Down SG&A Expenses: Broadcom Inc. vs Splunk Inc.
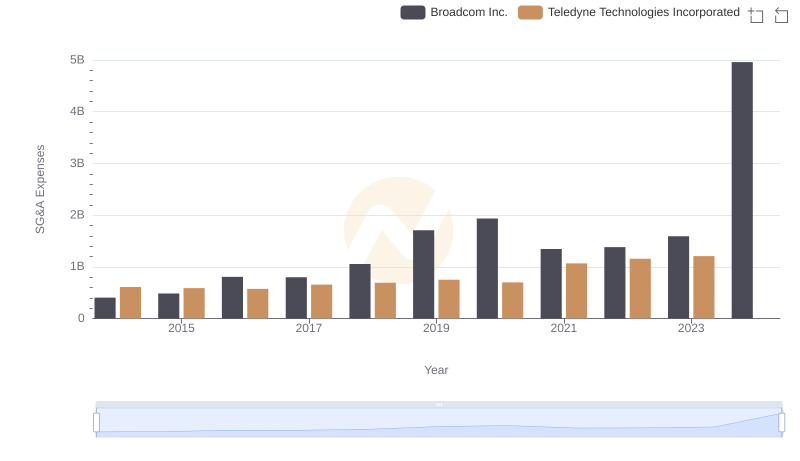
Comparing SG&A Expenses: Broadcom Inc. vs Teledyne Technologies Incorporated Trends and Insights
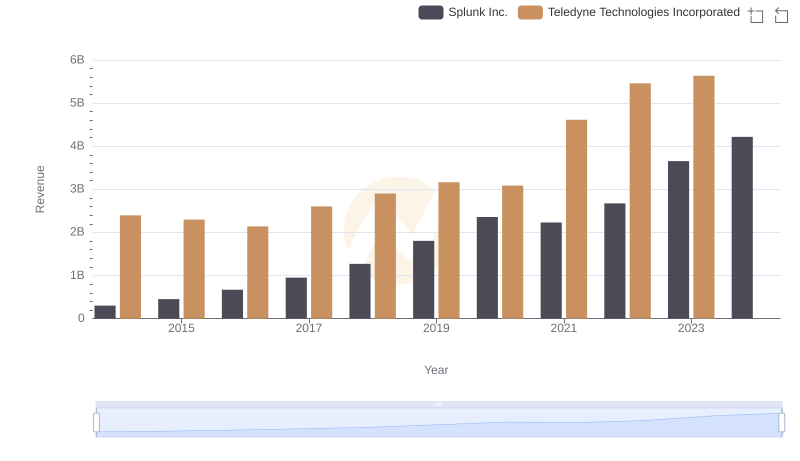
Annual Revenue Comparison: Splunk Inc. vs Teledyne Technologies Incorporated
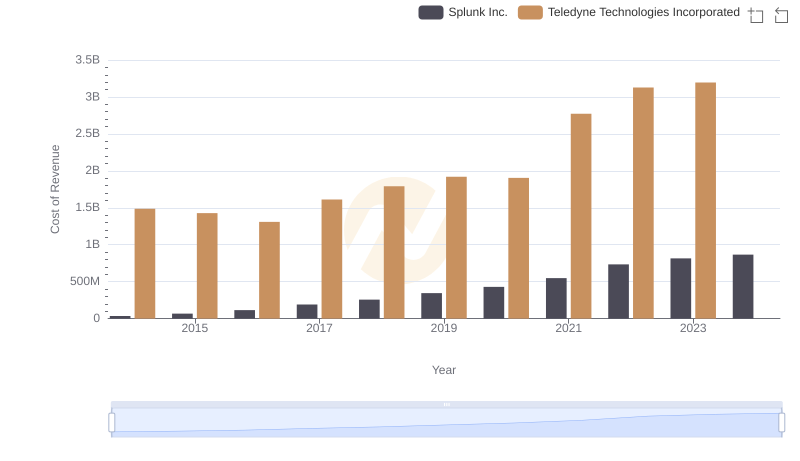
Cost of Revenue Comparison: Splunk Inc. vs Teledyne Technologies Incorporated
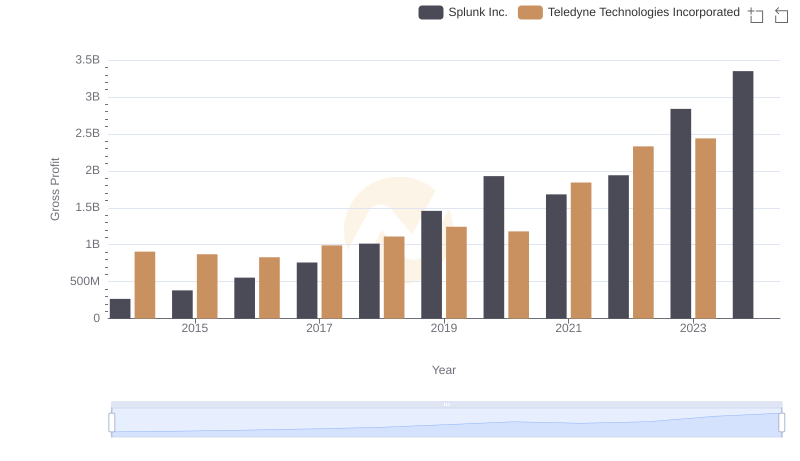
Gross Profit Analysis: Comparing Splunk Inc. and Teledyne Technologies Incorporated
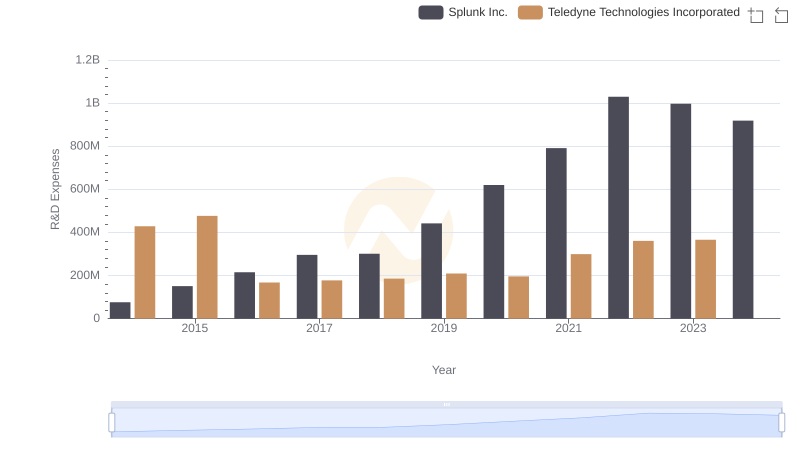
Research and Development: Comparing Key Metrics for Splunk Inc. and Teledyne Technologies Incorporated