| __timestamp | Splunk Inc. | Teledyne Technologies Incorporated |
|---|---|---|
| Wednesday, January 1, 2014 | 75895000 | 428800000 |
| Thursday, January 1, 2015 | 150790000 | 476600000 |
| Friday, January 1, 2016 | 215309000 | 167700000 |
| Sunday, January 1, 2017 | 295850000 | 177700000 |
| Monday, January 1, 2018 | 301114000 | 185600000 |
| Tuesday, January 1, 2019 | 441969000 | 209600000 |
| Wednesday, January 1, 2020 | 619800000 | 196000000 |
| Friday, January 1, 2021 | 791026000 | 299300000 |
| Saturday, January 1, 2022 | 1029574000 | 360600000 |
| Sunday, January 1, 2023 | 997170000 | 365800000 |
| Monday, January 1, 2024 | 918834000 |
Unleashing the power of data
In the ever-evolving tech landscape, research and development (R&D) investments are pivotal for innovation and growth. Over the past decade, Splunk Inc. and Teledyne Technologies Incorporated have demonstrated contrasting R&D strategies. Splunk Inc., a leader in data analytics, has seen its R&D expenses surge by over 1,200% from 2014 to 2023, reflecting its commitment to staying at the forefront of technological advancements. In contrast, Teledyne Technologies, a diversified industrial conglomerate, has maintained a more stable R&D expenditure, with a modest increase of around 15% over the same period.
This divergence highlights the distinct paths these companies have taken: Splunk's aggressive investment in innovation versus Teledyne's steady, diversified approach. Notably, data for Teledyne in 2024 is missing, suggesting potential shifts in strategy. As we look to the future, these R&D trends will likely shape the competitive dynamics in their respective industries.
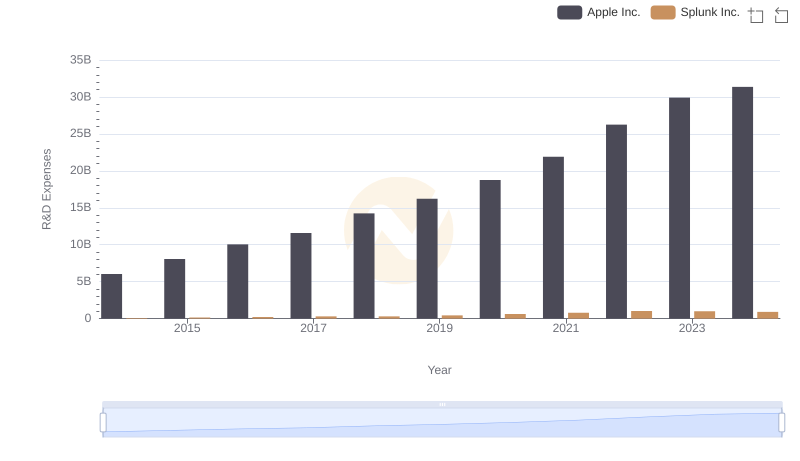
Comparing Innovation Spending: Apple Inc. and Splunk Inc.
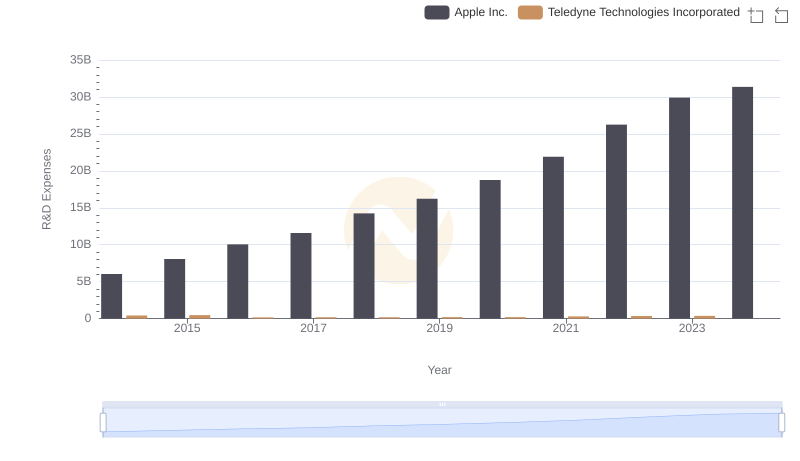
Who Prioritizes Innovation? R&D Spending Compared for Apple Inc. and Teledyne Technologies Incorporated
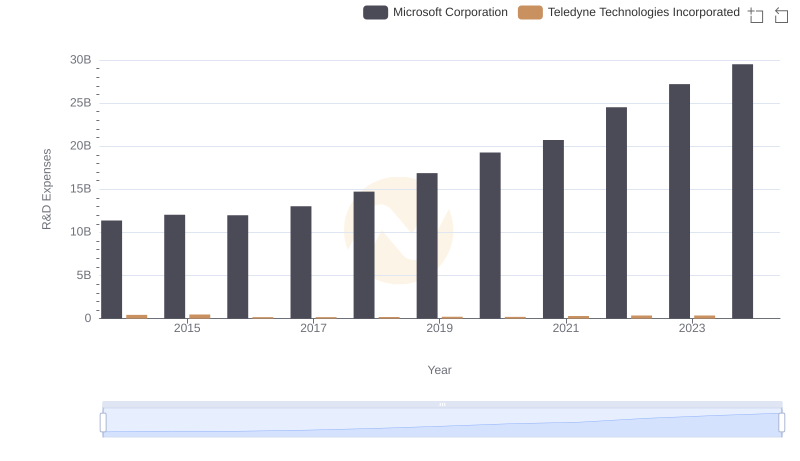
R&D Insights: How Microsoft Corporation and Teledyne Technologies Incorporated Allocate Funds
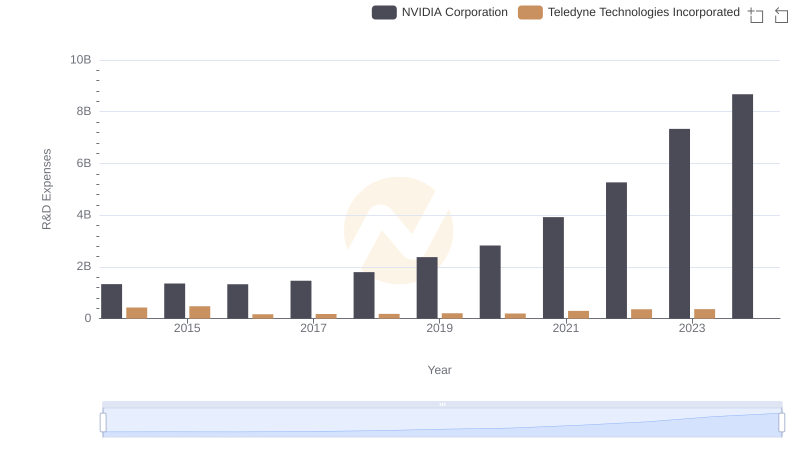
Research and Development: Comparing Key Metrics for NVIDIA Corporation and Teledyne Technologies Incorporated
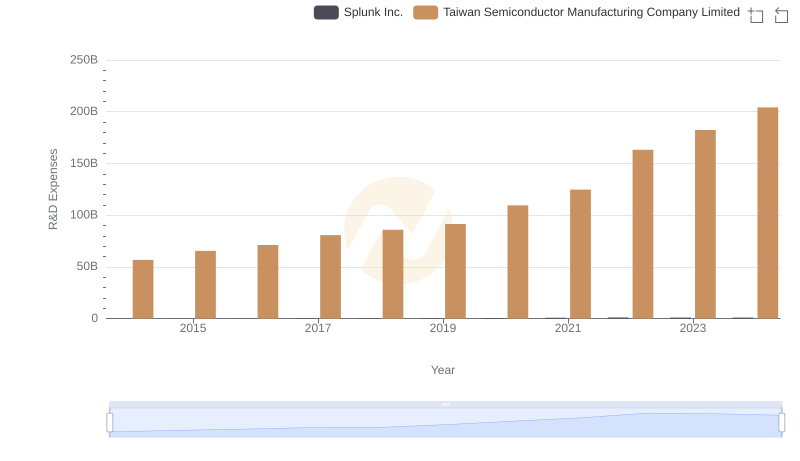
Analyzing R&D Budgets: Taiwan Semiconductor Manufacturing Company Limited vs Splunk Inc.
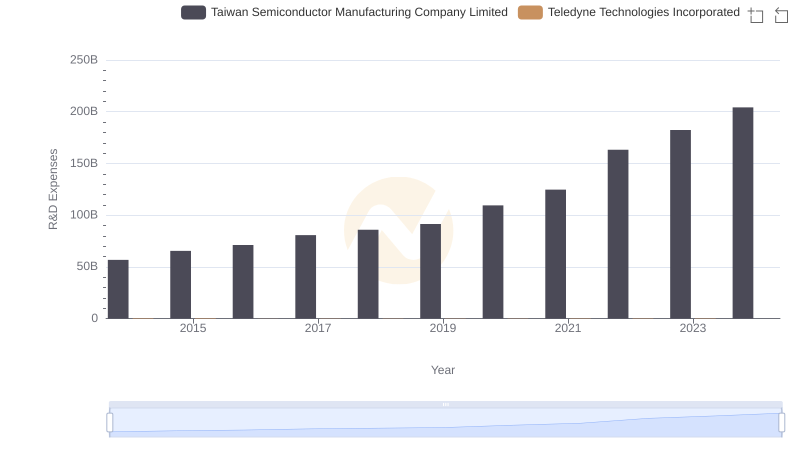
Research and Development Investment: Taiwan Semiconductor Manufacturing Company Limited vs Teledyne Technologies Incorporated
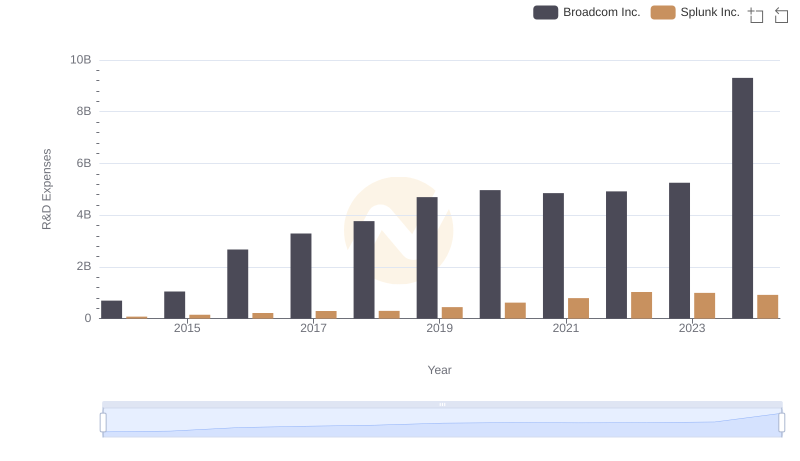
Comparing Innovation Spending: Broadcom Inc. and Splunk Inc.
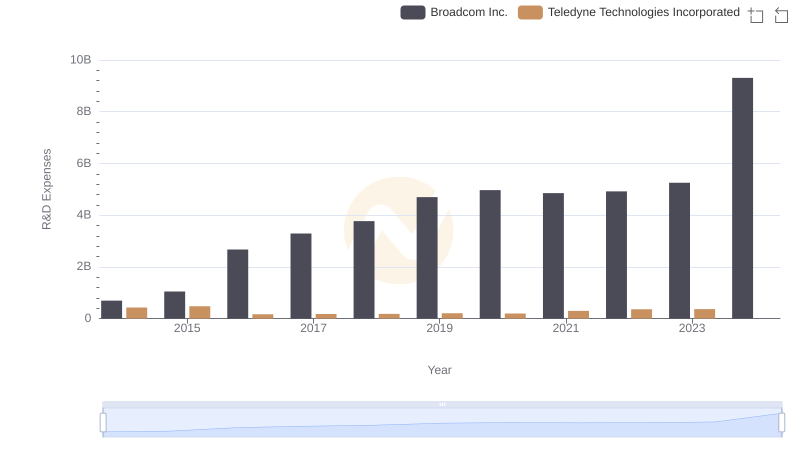
Analyzing R&D Budgets: Broadcom Inc. vs Teledyne Technologies Incorporated
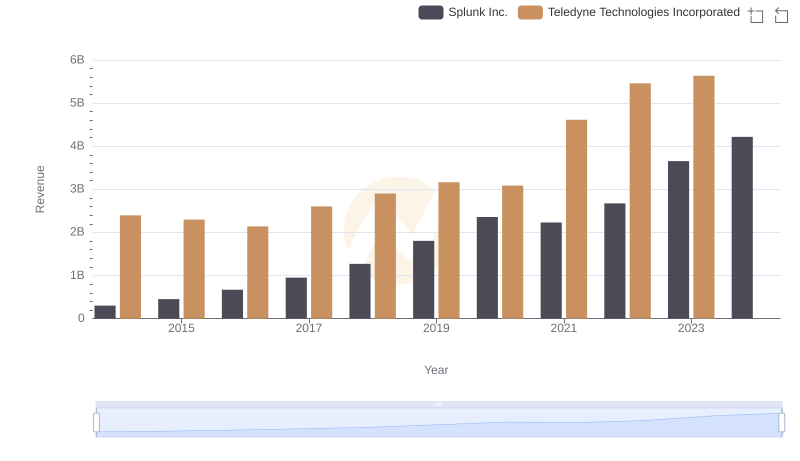
Annual Revenue Comparison: Splunk Inc. vs Teledyne Technologies Incorporated
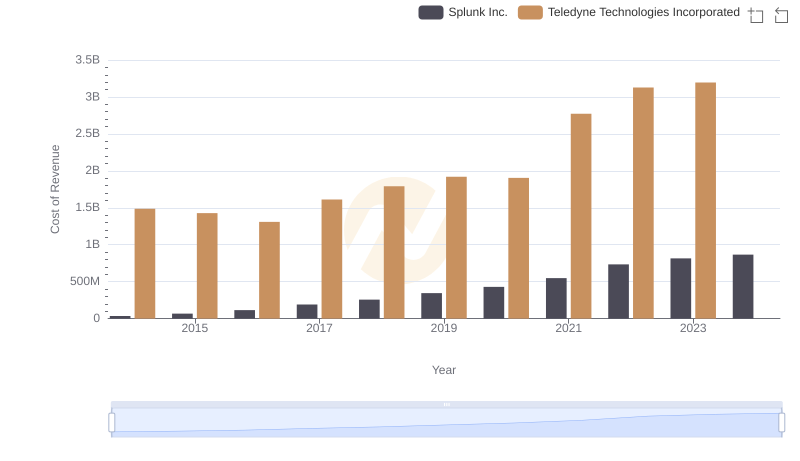
Cost of Revenue Comparison: Splunk Inc. vs Teledyne Technologies Incorporated
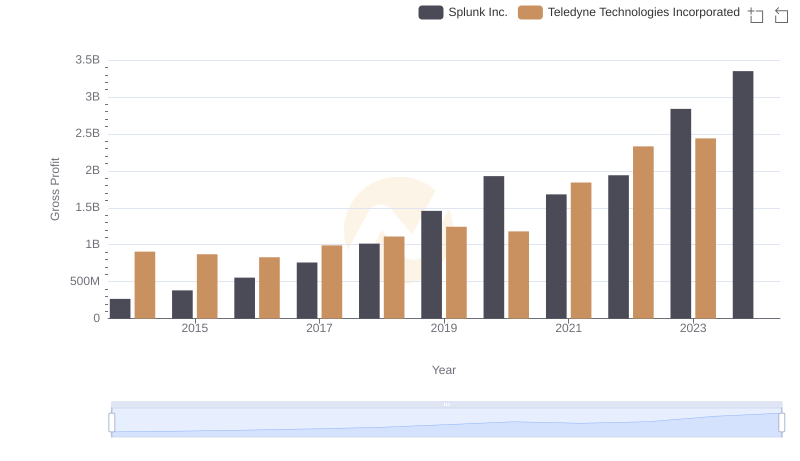
Gross Profit Analysis: Comparing Splunk Inc. and Teledyne Technologies Incorporated
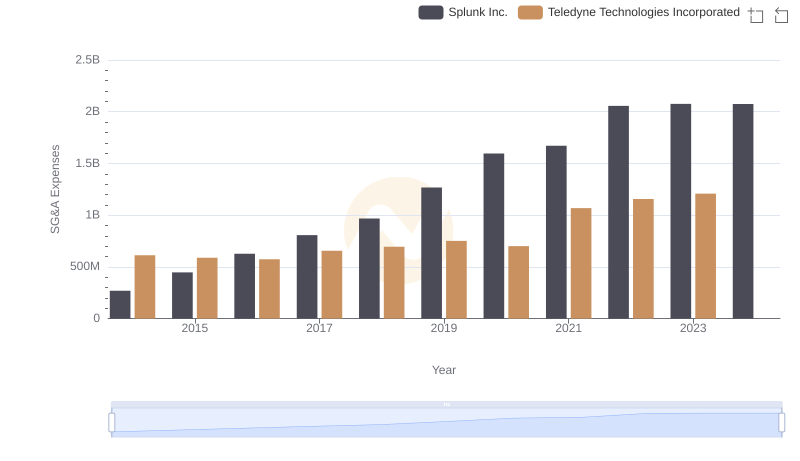
Splunk Inc. and Teledyne Technologies Incorporated: SG&A Spending Patterns Compared