| __timestamp | Splunk Inc. | Teledyne Technologies Incorporated |
|---|---|---|
| Wednesday, January 1, 2014 | 302623000 | 2394000000 |
| Thursday, January 1, 2015 | 450875000 | 2298100000 |
| Friday, January 1, 2016 | 668435000 | 2139800000 |
| Sunday, January 1, 2017 | 949955000 | 2603800000 |
| Monday, January 1, 2018 | 1270788000 | 2901800000 |
| Tuesday, January 1, 2019 | 1803010000 | 3163600000 |
| Wednesday, January 1, 2020 | 2358926000 | 3086200000 |
| Friday, January 1, 2021 | 2229385000 | 4614300000 |
| Saturday, January 1, 2022 | 2673664000 | 5458600000 |
| Sunday, January 1, 2023 | 3653708000 | 5635500000 |
| Monday, January 1, 2024 | 4215595000 |
Cracking the code
In the ever-evolving landscape of technology and innovation, Splunk Inc. and Teledyne Technologies Incorporated stand as titans in their respective fields. Over the past decade, these companies have demonstrated remarkable growth, with Splunk's revenue surging by over 1,300% from 2014 to 2023. Meanwhile, Teledyne Technologies has seen a robust 135% increase in the same period.
Splunk, a leader in data analytics, has consistently expanded its market presence, reaching a peak revenue of approximately $4.2 billion in 2024. On the other hand, Teledyne, known for its advanced instrumentation and digital imaging solutions, achieved a significant milestone with a revenue of $5.6 billion in 2023.
While both companies have shown impressive growth, Teledyne's revenue consistently outpaced Splunk's, highlighting its strong market position. However, the absence of data for Teledyne in 2024 leaves room for speculation about its future trajectory.
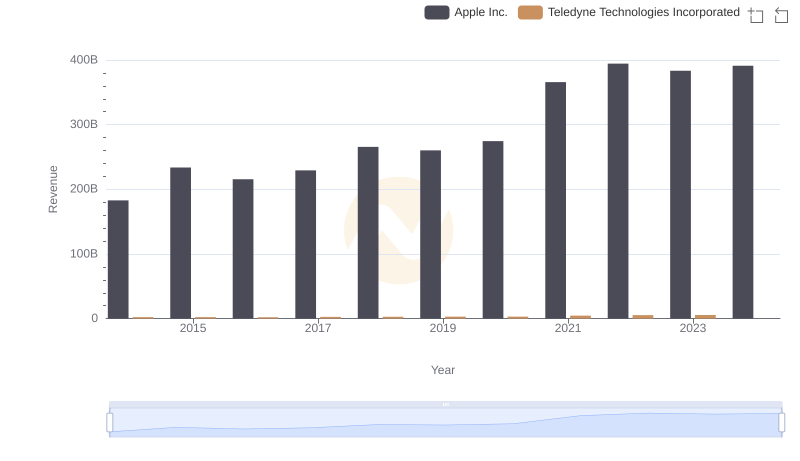
Comparing Revenue Performance: Apple Inc. or Teledyne Technologies Incorporated?
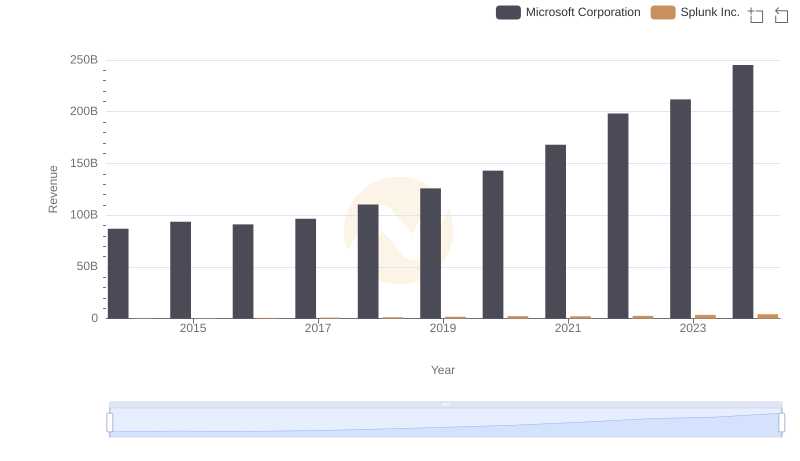
Microsoft Corporation vs Splunk Inc.: Examining Key Revenue Metrics
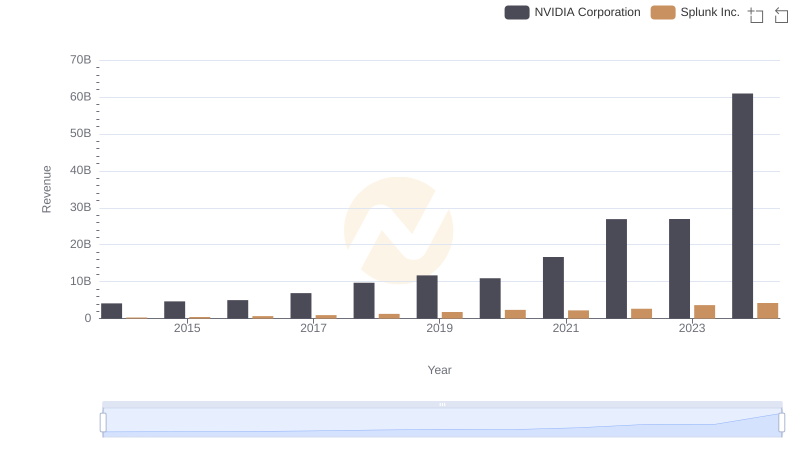
Who Generates More Revenue? NVIDIA Corporation or Splunk Inc.
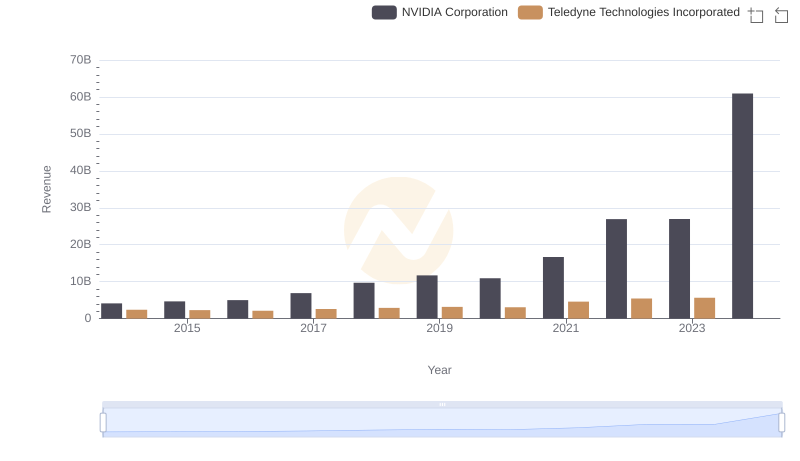
NVIDIA Corporation and Teledyne Technologies Incorporated: A Comprehensive Revenue Analysis
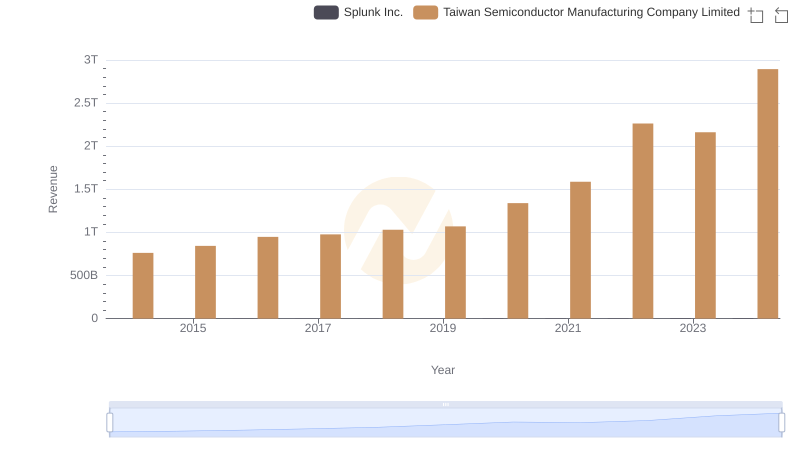
Revenue Insights: Taiwan Semiconductor Manufacturing Company Limited and Splunk Inc. Performance Compared
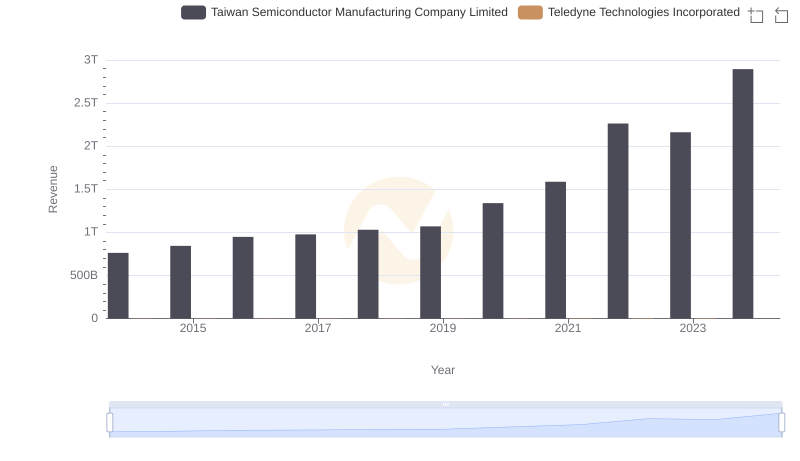
Taiwan Semiconductor Manufacturing Company Limited and Teledyne Technologies Incorporated: A Comprehensive Revenue Analysis
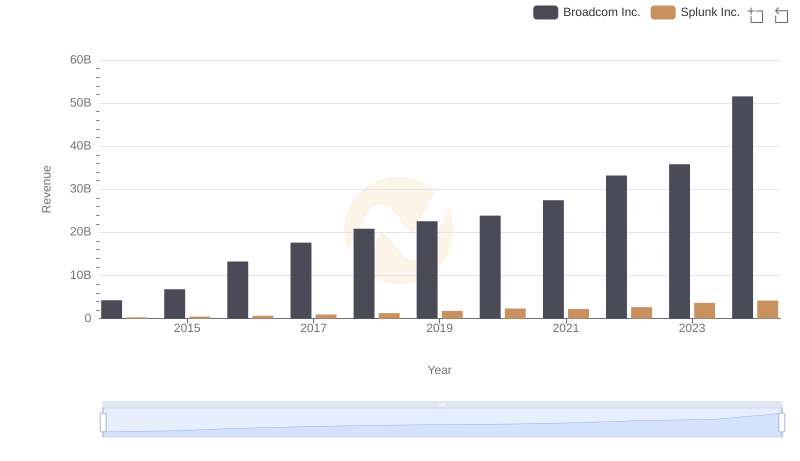
Broadcom Inc. and Splunk Inc.: A Comprehensive Revenue Analysis
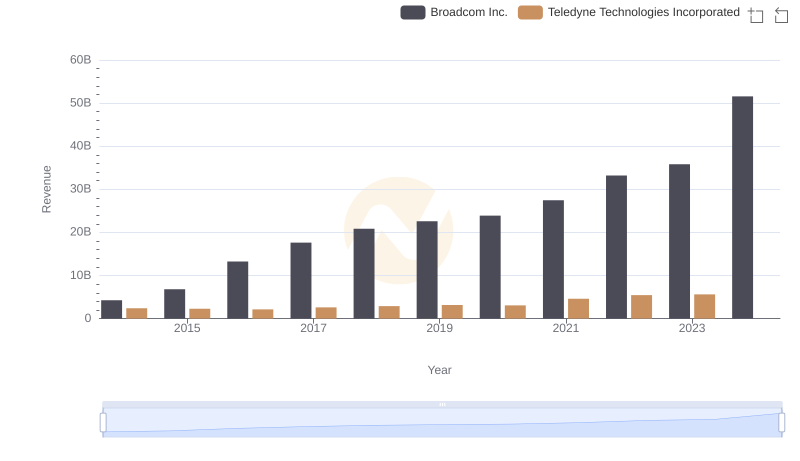
Revenue Insights: Broadcom Inc. and Teledyne Technologies Incorporated Performance Compared
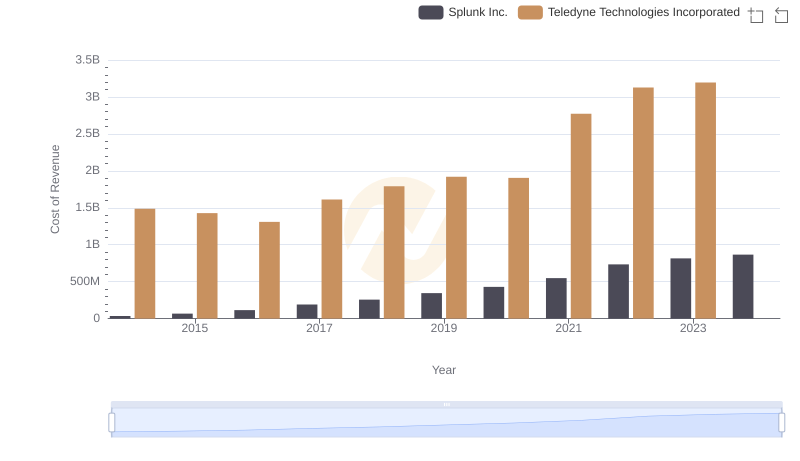
Cost of Revenue Comparison: Splunk Inc. vs Teledyne Technologies Incorporated
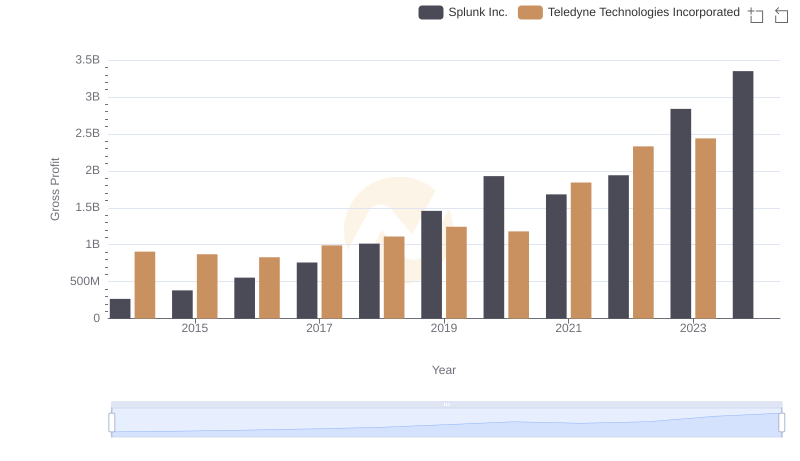
Gross Profit Analysis: Comparing Splunk Inc. and Teledyne Technologies Incorporated
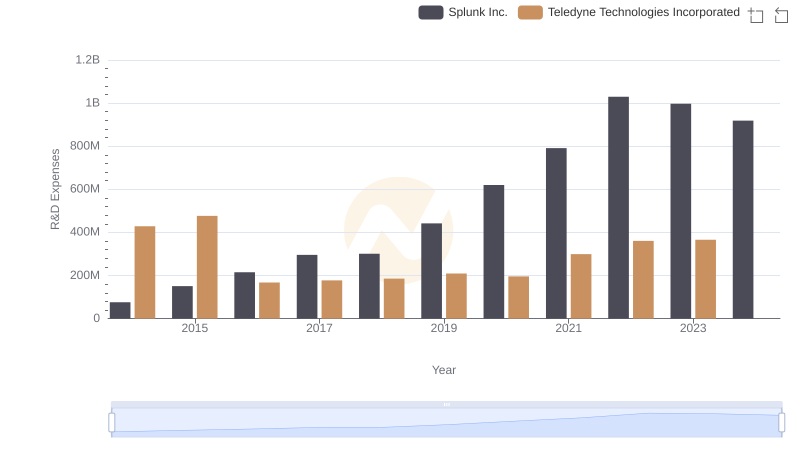
Research and Development: Comparing Key Metrics for Splunk Inc. and Teledyne Technologies Incorporated
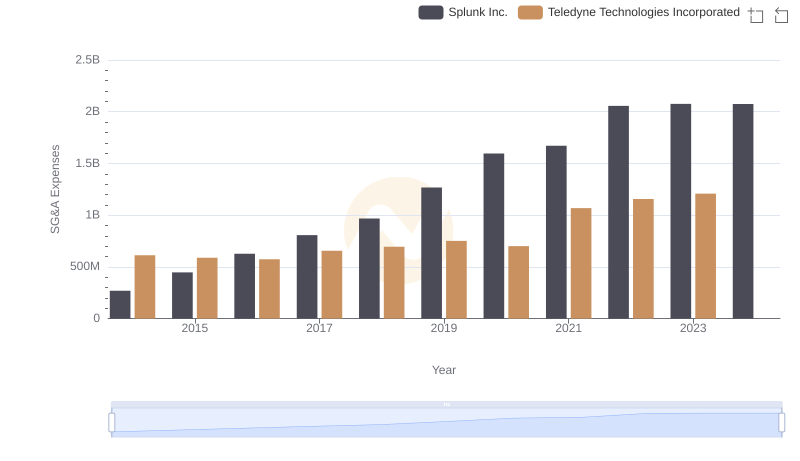
Splunk Inc. and Teledyne Technologies Incorporated: SG&A Spending Patterns Compared