| __timestamp | Splunk Inc. | Teledyne Technologies Incorporated |
|---|---|---|
| Wednesday, January 1, 2014 | 35825000 | 1487100000 |
| Thursday, January 1, 2015 | 68378000 | 1427800000 |
| Friday, January 1, 2016 | 114122000 | 1308800000 |
| Sunday, January 1, 2017 | 191053000 | 1612200000 |
| Monday, January 1, 2018 | 256409000 | 1791000000 |
| Tuesday, January 1, 2019 | 344676000 | 1920300000 |
| Wednesday, January 1, 2020 | 429788000 | 1905300000 |
| Friday, January 1, 2021 | 547345000 | 2772900000 |
| Saturday, January 1, 2022 | 733969000 | 3128300000 |
| Sunday, January 1, 2023 | 815995000 | 3196100000 |
| Monday, January 1, 2024 | 865507000 |
Infusing magic into the data realm
In the ever-evolving tech landscape, understanding cost structures is crucial. Splunk Inc. and Teledyne Technologies Incorporated offer a fascinating comparison. From 2014 to 2023, Splunk's cost of revenue surged by over 2,300%, reflecting its rapid growth and expansion. In contrast, Teledyne's costs increased by approximately 115%, showcasing a more stable growth trajectory.
Splunk's cost of revenue, starting at just 36 million in 2014, reached a peak of 866 million by 2023. This dramatic rise underscores its aggressive market strategies and scaling operations. Meanwhile, Teledyne's costs, which began at 1.49 billion in 2014, climbed steadily to 3.20 billion in 2023, highlighting its consistent market presence.
Interestingly, data for Teledyne in 2024 is missing, leaving room for speculation on its future financial strategies. This comparison not only highlights differing growth strategies but also offers insights into the broader tech industry's financial dynamics.
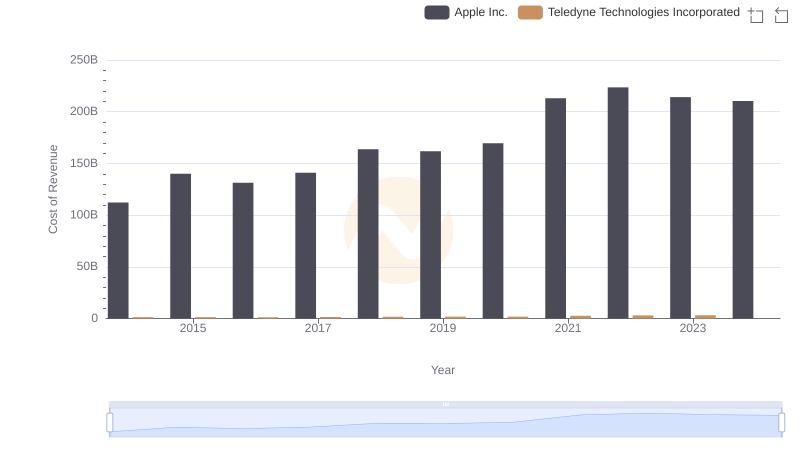
Analyzing Cost of Revenue: Apple Inc. and Teledyne Technologies Incorporated
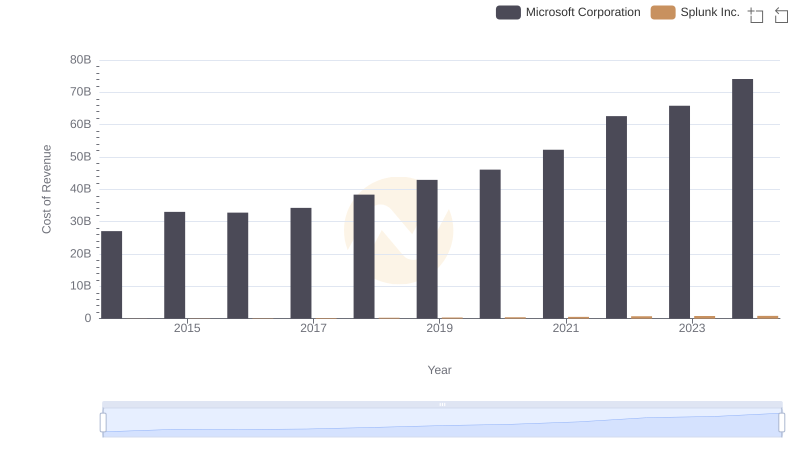
Analyzing Cost of Revenue: Microsoft Corporation and Splunk Inc.
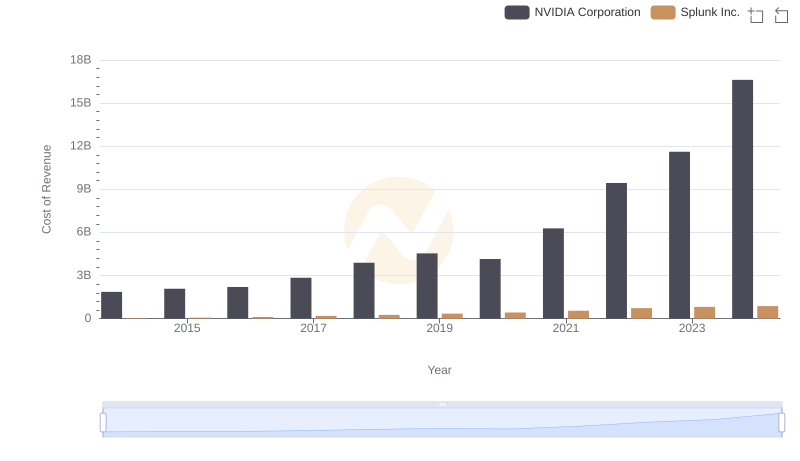
Comparing Cost of Revenue Efficiency: NVIDIA Corporation vs Splunk Inc.
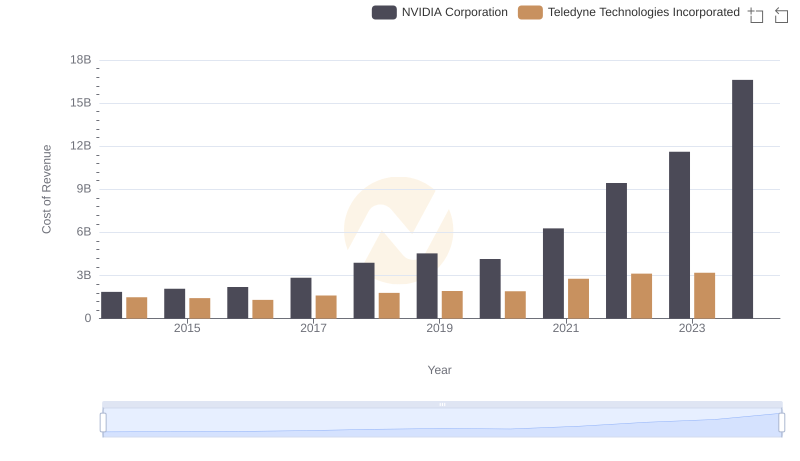
Cost of Revenue Comparison: NVIDIA Corporation vs Teledyne Technologies Incorporated
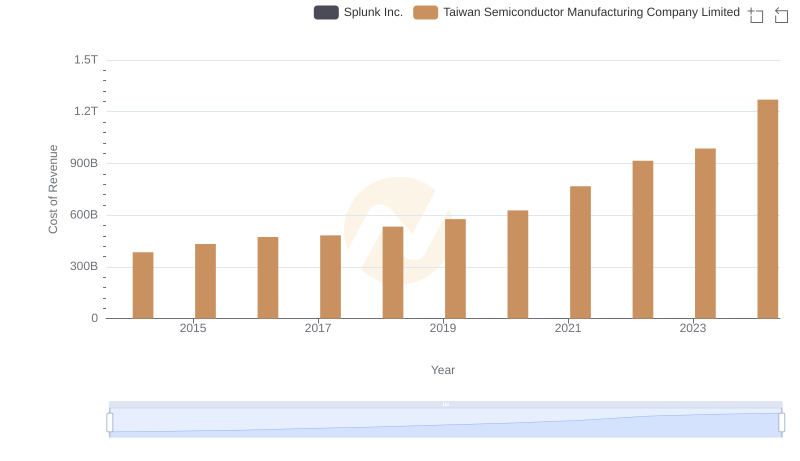
Cost of Revenue: Key Insights for Taiwan Semiconductor Manufacturing Company Limited and Splunk Inc.
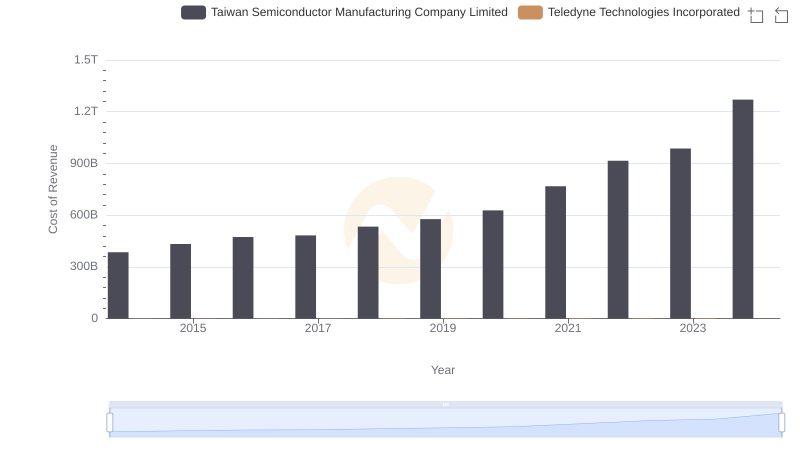
Analyzing Cost of Revenue: Taiwan Semiconductor Manufacturing Company Limited and Teledyne Technologies Incorporated
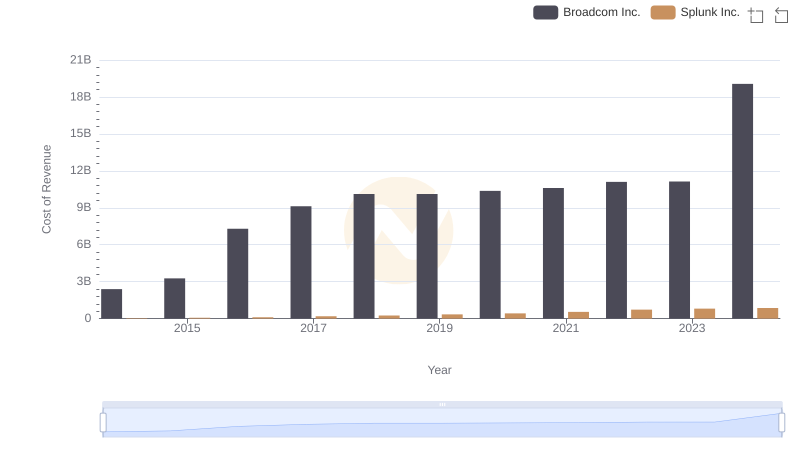
Cost of Revenue Trends: Broadcom Inc. vs Splunk Inc.
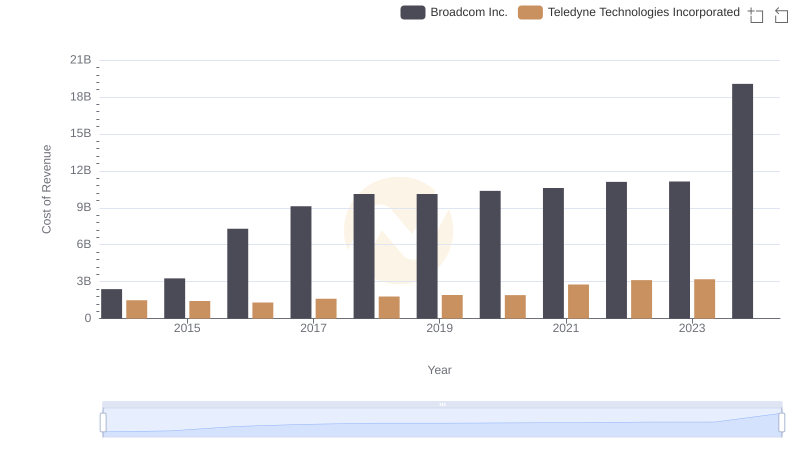
Broadcom Inc. vs Teledyne Technologies Incorporated: Efficiency in Cost of Revenue Explored
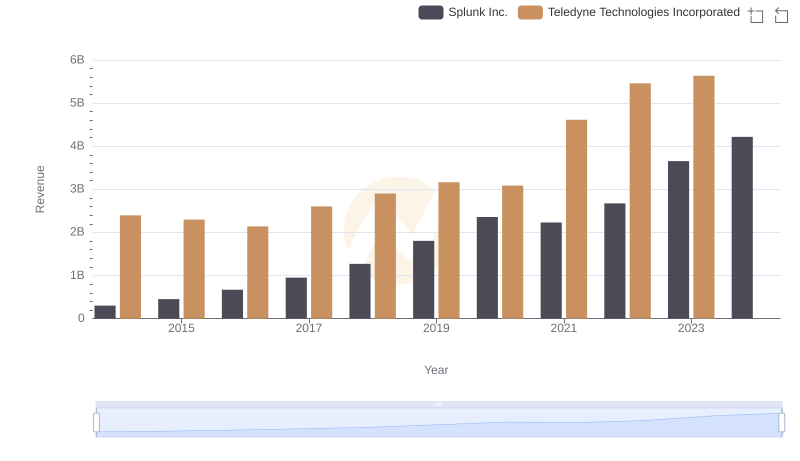
Annual Revenue Comparison: Splunk Inc. vs Teledyne Technologies Incorporated
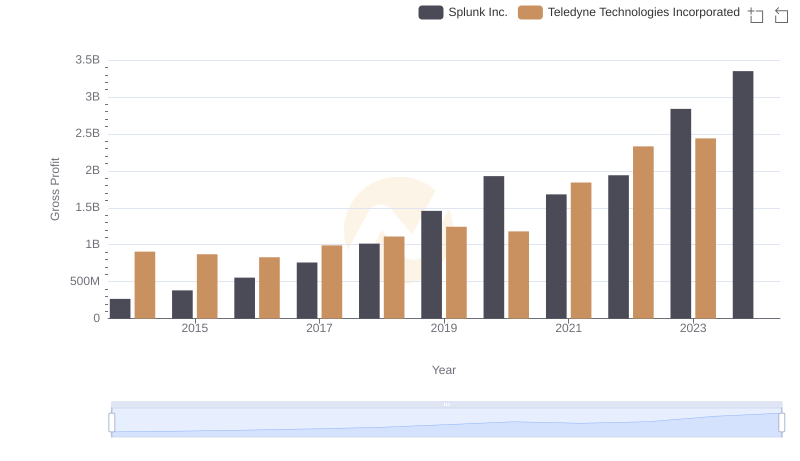
Gross Profit Analysis: Comparing Splunk Inc. and Teledyne Technologies Incorporated
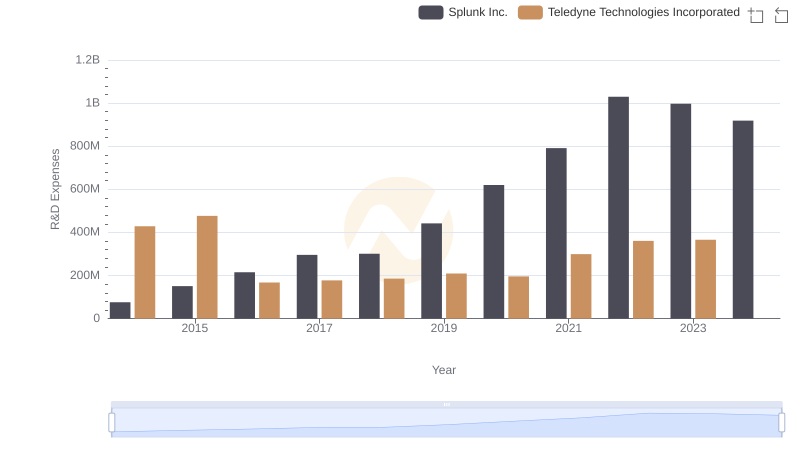
Research and Development: Comparing Key Metrics for Splunk Inc. and Teledyne Technologies Incorporated
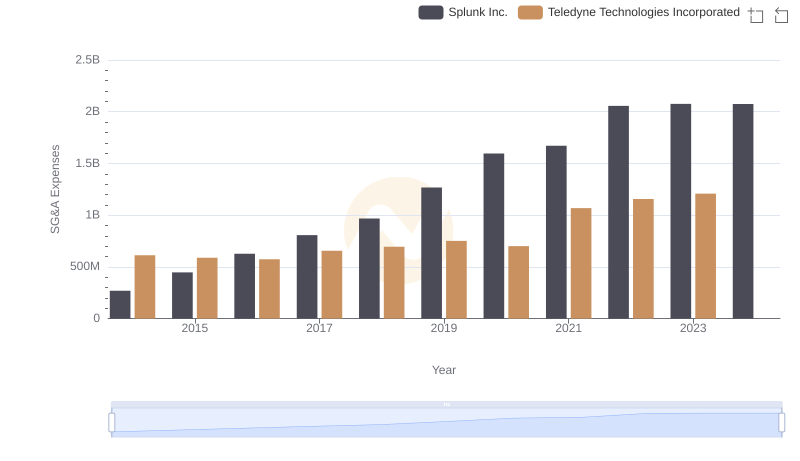
Splunk Inc. and Teledyne Technologies Incorporated: SG&A Spending Patterns Compared