| __timestamp | ASE Technology Holding Co., Ltd. | Splunk Inc. |
|---|---|---|
| Wednesday, January 1, 2014 | 13673000000 | 269210000 |
| Thursday, January 1, 2015 | 14295000000 | 447517000 |
| Friday, January 1, 2016 | 15099000000 | 626927000 |
| Sunday, January 1, 2017 | 15767000000 | 806883000 |
| Monday, January 1, 2018 | 19552000000 | 967560000 |
| Tuesday, January 1, 2019 | 22389000000 | 1267538000 |
| Wednesday, January 1, 2020 | 23806000000 | 1596475000 |
| Friday, January 1, 2021 | 27191000000 | 1671200000 |
| Saturday, January 1, 2022 | 30384000000 | 2056950000 |
| Sunday, January 1, 2023 | 25930017000 | 2076049000 |
| Monday, January 1, 2024 | 27353513000 | 2074630000 |
Data in motion
In the ever-evolving tech landscape, understanding spending patterns is crucial. Splunk Inc. and ASE Technology Holding Co., Ltd. offer a fascinating study in contrasts. From 2014 to 2023, ASE Technology's SG&A expenses surged by approximately 90%, peaking in 2022. This growth reflects their aggressive expansion strategy. In contrast, Splunk Inc. exhibited a steady increase, with a notable 670% rise over the same period, highlighting their focus on scaling operations. Interestingly, 2023 saw a dip in ASE's expenses, possibly indicating a strategic shift or market adaptation. Meanwhile, Splunk's spending plateaued, suggesting a stabilization phase. These trends underscore the dynamic nature of tech industry strategies, where spending is a key indicator of growth and adaptation.
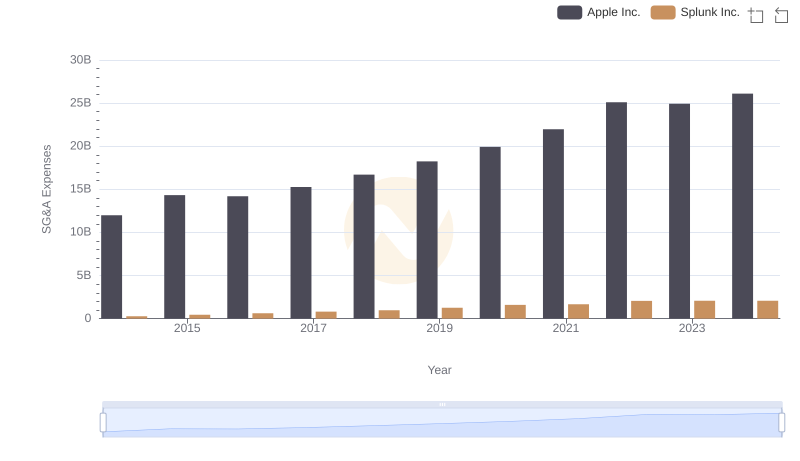
Operational Costs Compared: SG&A Analysis of Apple Inc. and Splunk Inc.
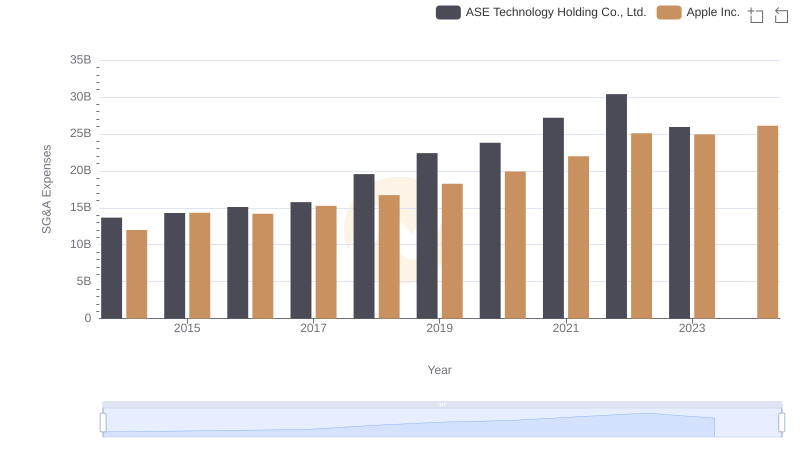
Apple Inc. vs ASE Technology Holding Co., Ltd.: SG&A Expense Trends
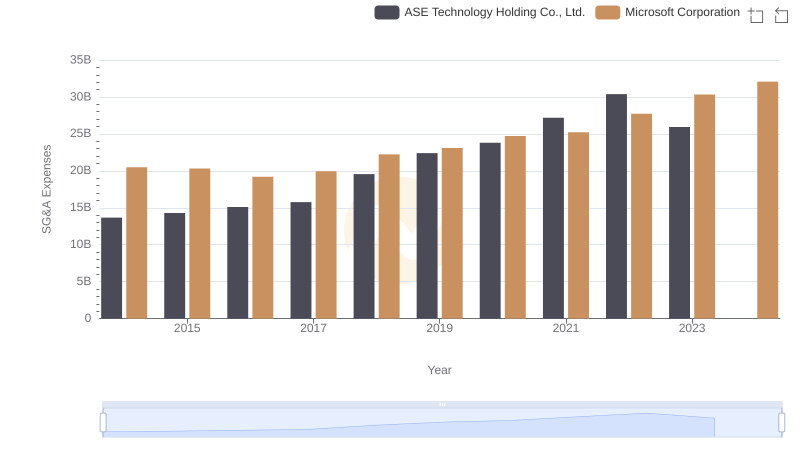
Who Optimizes SG&A Costs Better? Microsoft Corporation or ASE Technology Holding Co., Ltd.
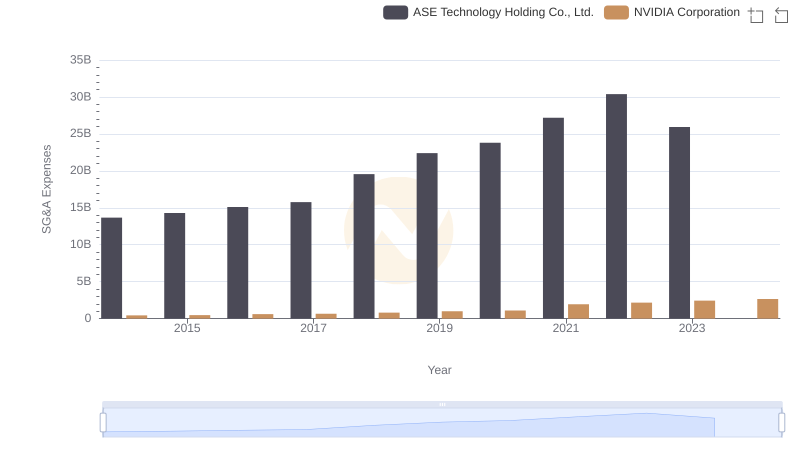
Operational Costs Compared: SG&A Analysis of NVIDIA Corporation and ASE Technology Holding Co., Ltd.
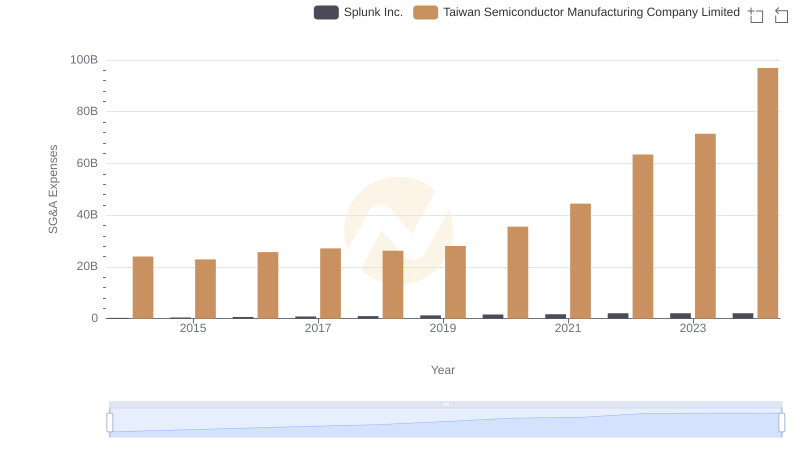
Operational Costs Compared: SG&A Analysis of Taiwan Semiconductor Manufacturing Company Limited and Splunk Inc.
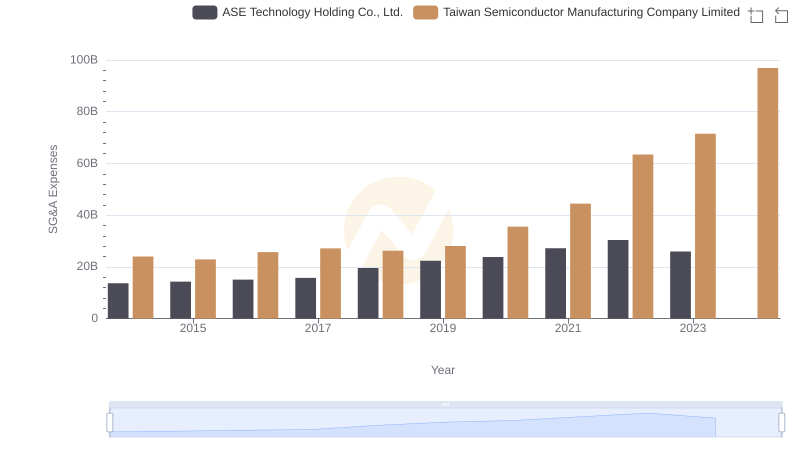
Who Optimizes SG&A Costs Better? Taiwan Semiconductor Manufacturing Company Limited or ASE Technology Holding Co., Ltd.
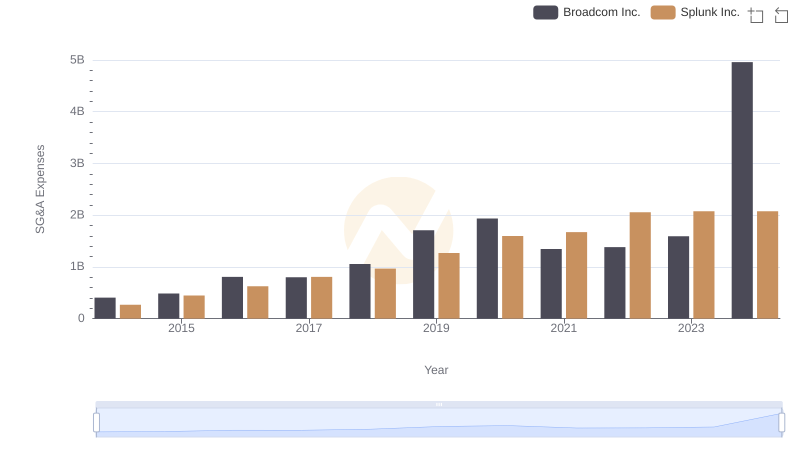
Breaking Down SG&A Expenses: Broadcom Inc. vs Splunk Inc.
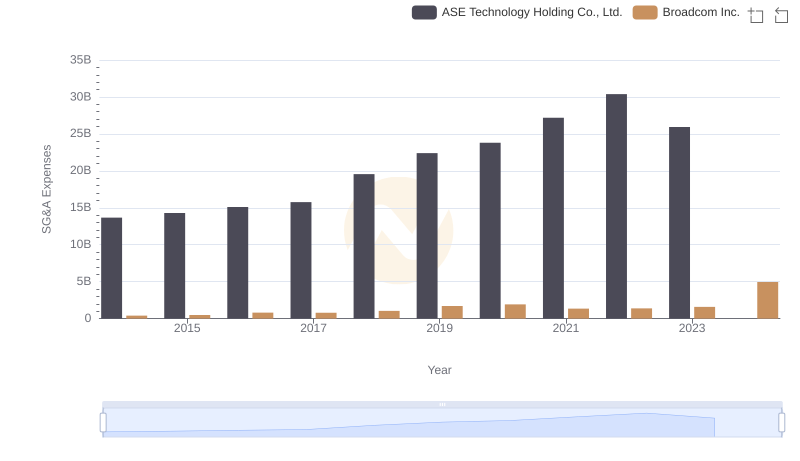
Breaking Down SG&A Expenses: Broadcom Inc. vs ASE Technology Holding Co., Ltd.
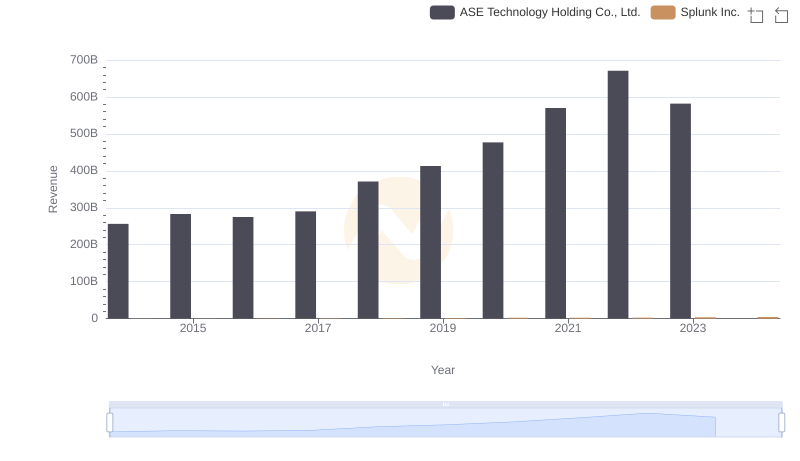
Splunk Inc. or ASE Technology Holding Co., Ltd.: Who Leads in Yearly Revenue?
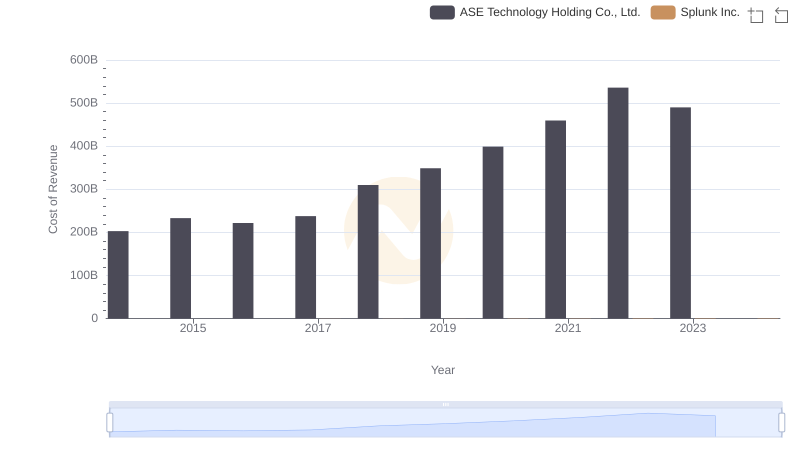
Cost Insights: Breaking Down Splunk Inc. and ASE Technology Holding Co., Ltd.'s Expenses
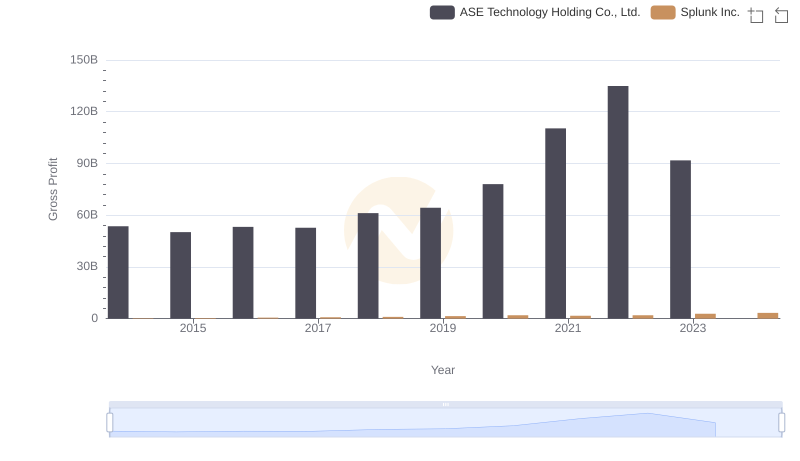
Splunk Inc. and ASE Technology Holding Co., Ltd.: A Detailed Gross Profit Analysis
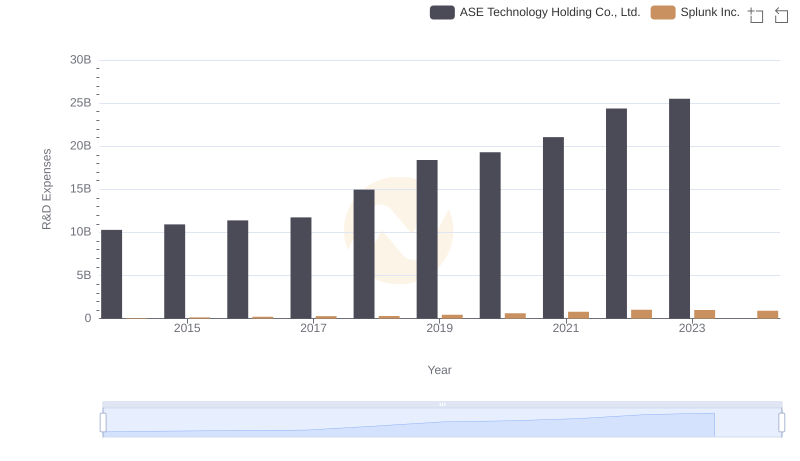
R&D Spending Showdown: Splunk Inc. vs ASE Technology Holding Co., Ltd.