| __timestamp | ASE Technology Holding Co., Ltd. | Splunk Inc. |
|---|---|---|
| Wednesday, January 1, 2014 | 203051000000 | 35825000 |
| Thursday, January 1, 2015 | 233153000000 | 68378000 |
| Friday, January 1, 2016 | 221690000000 | 114122000 |
| Sunday, January 1, 2017 | 237709000000 | 191053000 |
| Monday, January 1, 2018 | 309929000000 | 256409000 |
| Tuesday, January 1, 2019 | 348871000000 | 344676000 |
| Wednesday, January 1, 2020 | 398994000000 | 429788000 |
| Friday, January 1, 2021 | 459628000000 | 547345000 |
| Saturday, January 1, 2022 | 535943000000 | 733969000 |
| Sunday, January 1, 2023 | 490157339000 | 815995000 |
| Monday, January 1, 2024 | 499722880000 | 865507000 |
Unleashing the power of data
In the ever-evolving landscape of technology, understanding cost structures is pivotal. Over the past decade, ASE Technology Holding Co., Ltd. has consistently demonstrated a robust cost of revenue, peaking in 2022 with a staggering 165% increase from 2014. In contrast, Splunk Inc. has shown a steady rise, with its cost of revenue growing by approximately 2,300% over the same period. This stark difference highlights the diverse operational strategies of these tech giants. While ASE Technology's costs reflect its expansive manufacturing capabilities, Splunk's growth underscores its aggressive market expansion and investment in cloud services. Notably, 2023 saw a slight dip for ASE Technology, indicating potential shifts in production or market conditions. As we look to the future, these trends offer valuable insights into the financial health and strategic directions of these industry leaders.
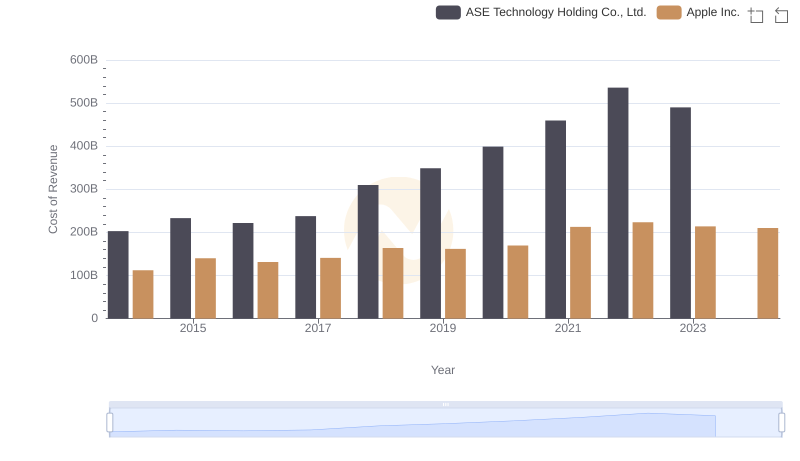
Comparing Cost of Revenue Efficiency: Apple Inc. vs ASE Technology Holding Co., Ltd.
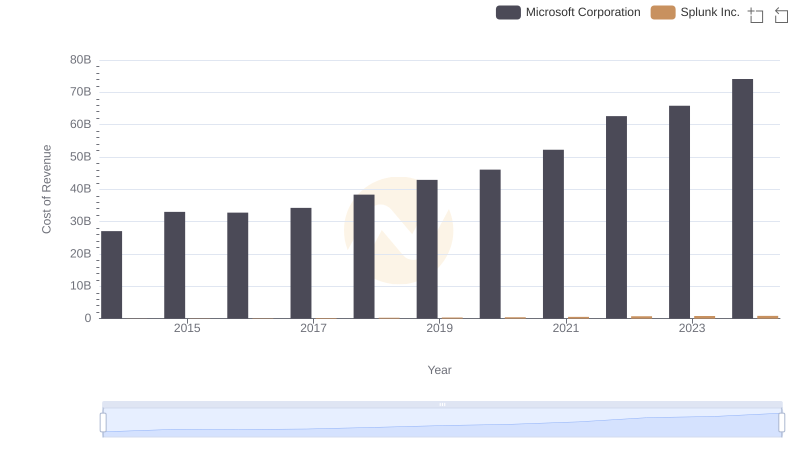
Analyzing Cost of Revenue: Microsoft Corporation and Splunk Inc.
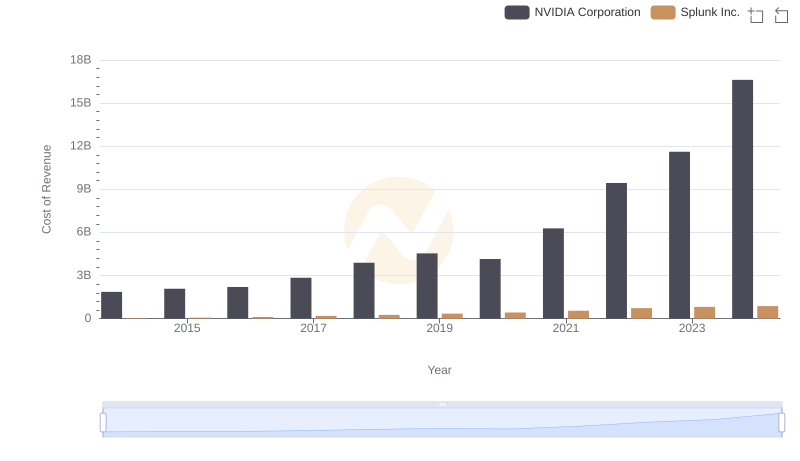
Comparing Cost of Revenue Efficiency: NVIDIA Corporation vs Splunk Inc.
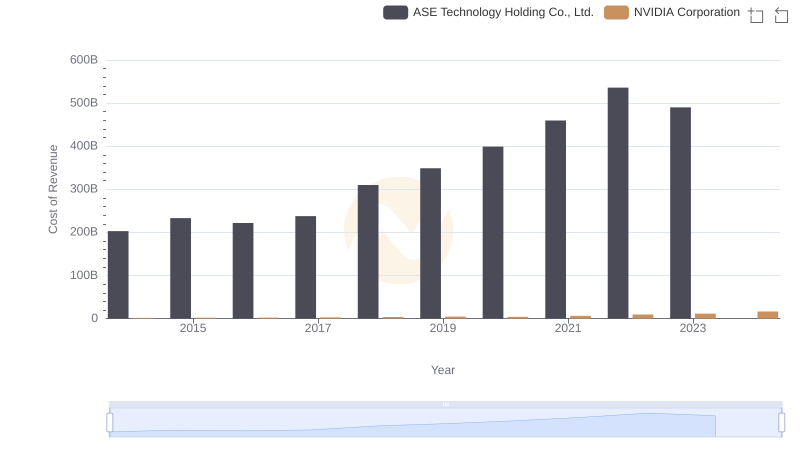
Analyzing Cost of Revenue: NVIDIA Corporation and ASE Technology Holding Co., Ltd.
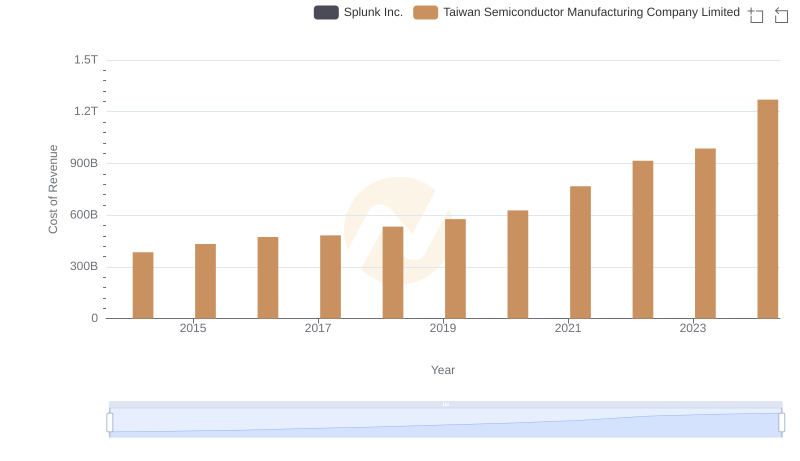
Cost of Revenue: Key Insights for Taiwan Semiconductor Manufacturing Company Limited and Splunk Inc.
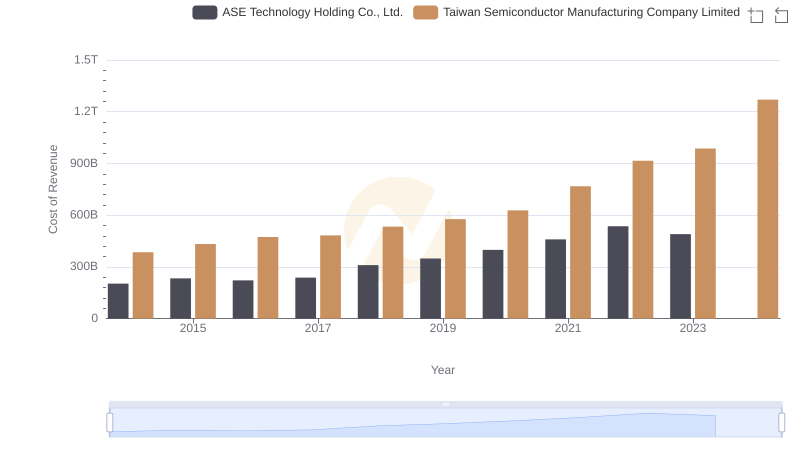
Cost Insights: Breaking Down Taiwan Semiconductor Manufacturing Company Limited and ASE Technology Holding Co., Ltd.'s Expenses
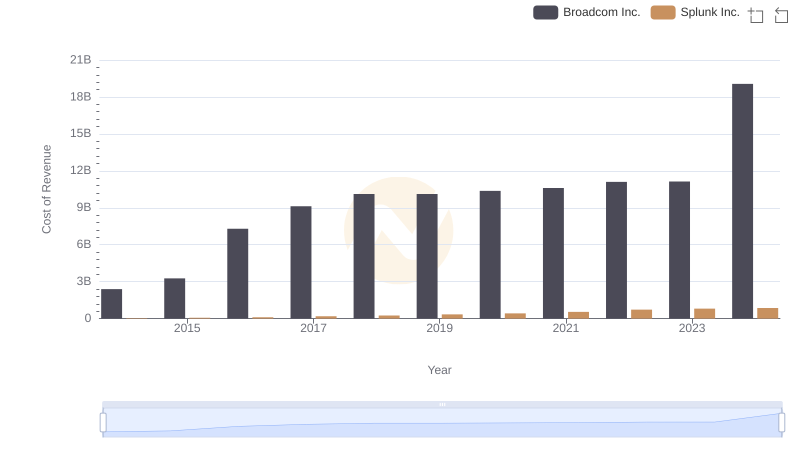
Cost of Revenue Trends: Broadcom Inc. vs Splunk Inc.
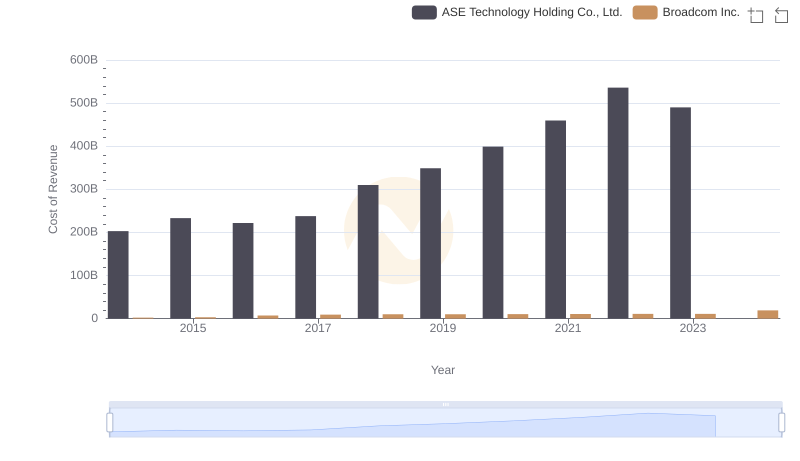
Analyzing Cost of Revenue: Broadcom Inc. and ASE Technology Holding Co., Ltd.
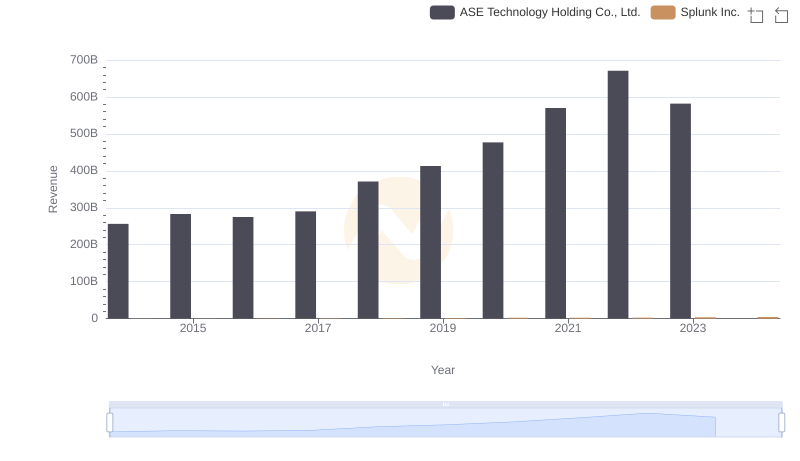
Splunk Inc. or ASE Technology Holding Co., Ltd.: Who Leads in Yearly Revenue?
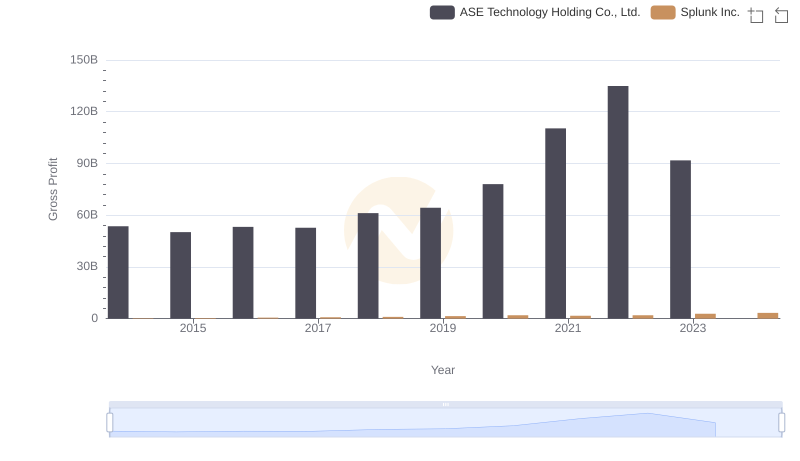
Splunk Inc. and ASE Technology Holding Co., Ltd.: A Detailed Gross Profit Analysis
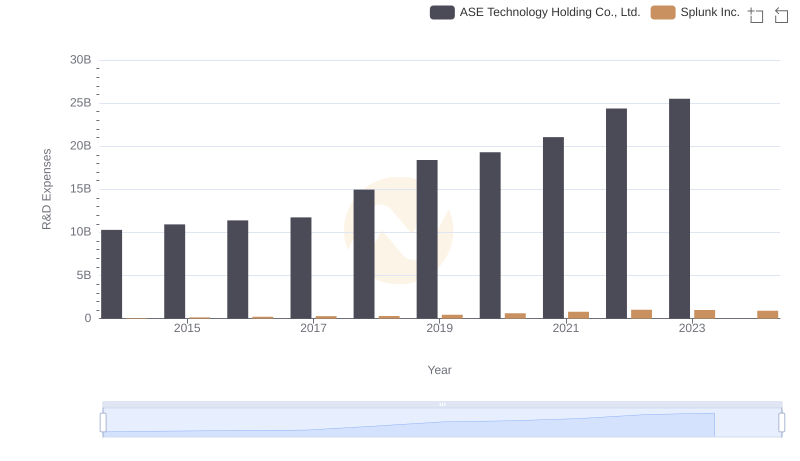
R&D Spending Showdown: Splunk Inc. vs ASE Technology Holding Co., Ltd.
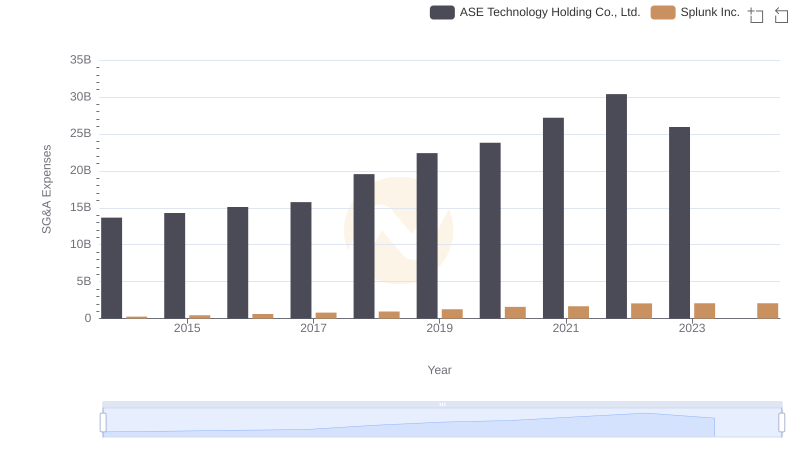
Splunk Inc. and ASE Technology Holding Co., Ltd.: SG&A Spending Patterns Compared