| __timestamp | ASE Technology Holding Co., Ltd. | Splunk Inc. |
|---|---|---|
| Wednesday, January 1, 2014 | 256591000000 | 302623000 |
| Thursday, January 1, 2015 | 283302000000 | 450875000 |
| Friday, January 1, 2016 | 274884000000 | 668435000 |
| Sunday, January 1, 2017 | 290441000000 | 949955000 |
| Monday, January 1, 2018 | 371092000000 | 1270788000 |
| Tuesday, January 1, 2019 | 413182000000 | 1803010000 |
| Wednesday, January 1, 2020 | 476978000000 | 2358926000 |
| Friday, January 1, 2021 | 569997000000 | 2229385000 |
| Saturday, January 1, 2022 | 670873000000 | 2673664000 |
| Sunday, January 1, 2023 | 581914471000 | 3653708000 |
| Monday, January 1, 2024 | 595410063000 | 4215595000 |
Data in motion
In the dynamic world of technology, revenue growth is a key indicator of a company's success. Over the past decade, ASE Technology Holding Co., Ltd. has consistently outpaced Splunk Inc. in terms of annual revenue. From 2014 to 2023, ASE Technology's revenue surged by approximately 127%, peaking in 2022. In contrast, Splunk Inc. experienced a robust growth of around 1,292% during the same period, albeit from a much smaller base.
ASE Technology's revenue reached its zenith in 2022, with a slight dip in 2023, indicating potential market challenges or strategic shifts. Meanwhile, Splunk Inc. has shown a steady upward trajectory, with its revenue in 2023 being nearly 14 times higher than in 2014. This growth highlights Splunk's expanding footprint in the tech industry, despite its smaller scale compared to ASE Technology.
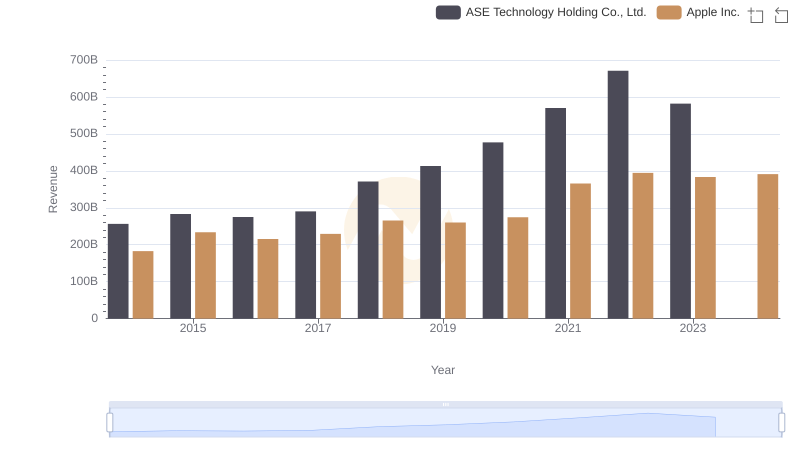
Apple Inc. or ASE Technology Holding Co., Ltd.: Who Leads in Yearly Revenue?
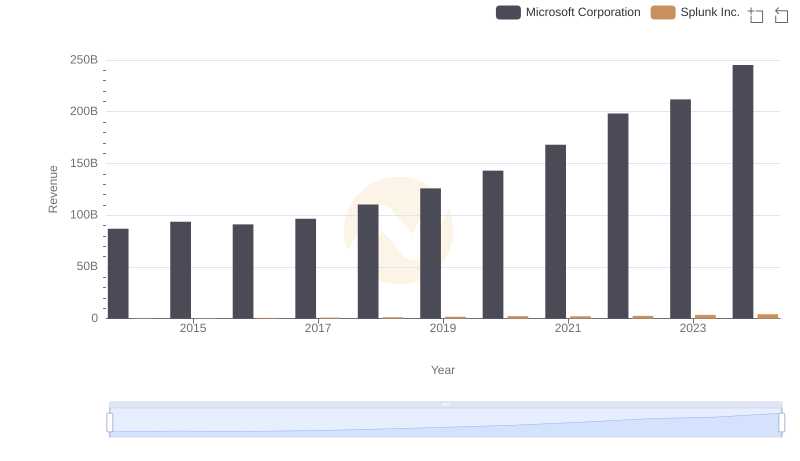
Microsoft Corporation vs Splunk Inc.: Examining Key Revenue Metrics
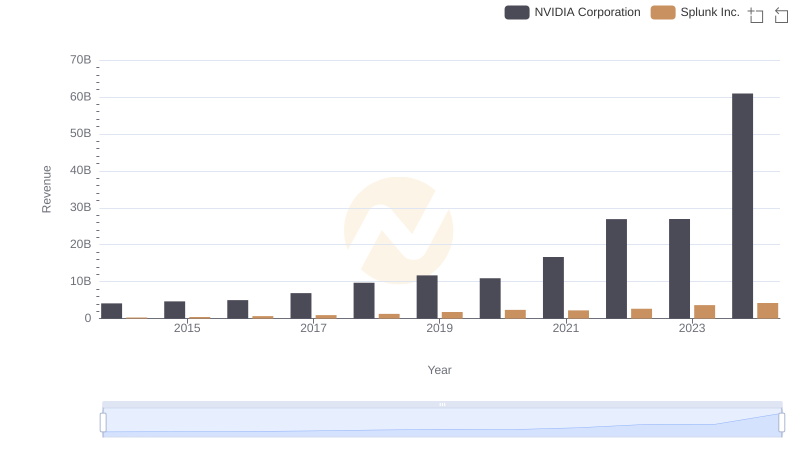
Who Generates More Revenue? NVIDIA Corporation or Splunk Inc.
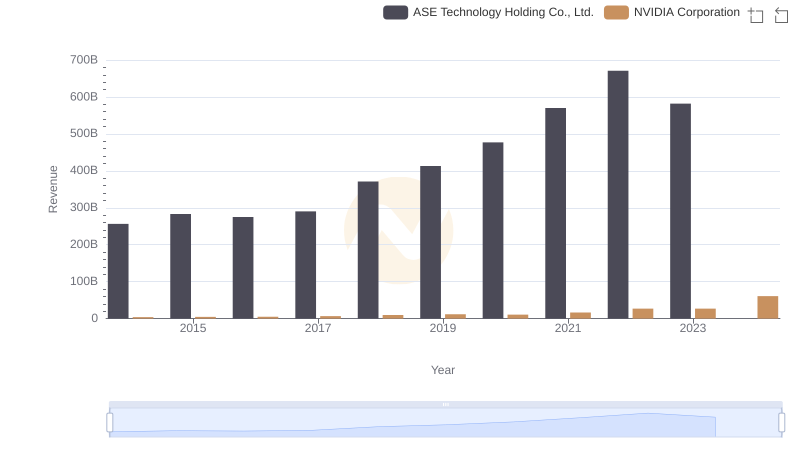
NVIDIA Corporation vs ASE Technology Holding Co., Ltd.: Annual Revenue Growth Compared
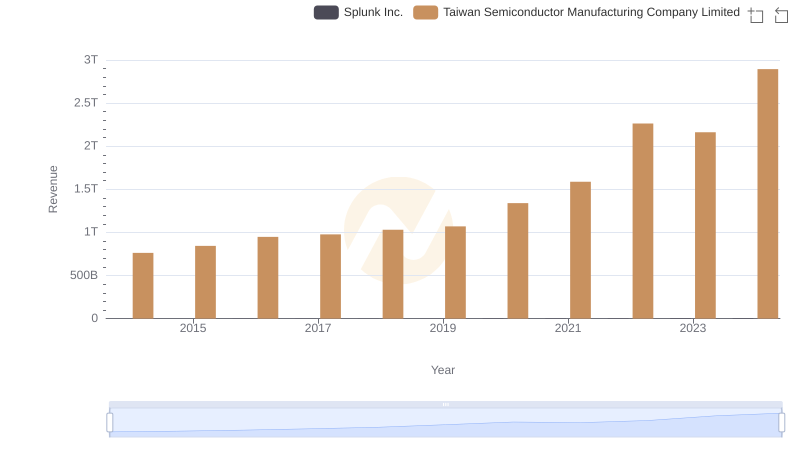
Revenue Insights: Taiwan Semiconductor Manufacturing Company Limited and Splunk Inc. Performance Compared
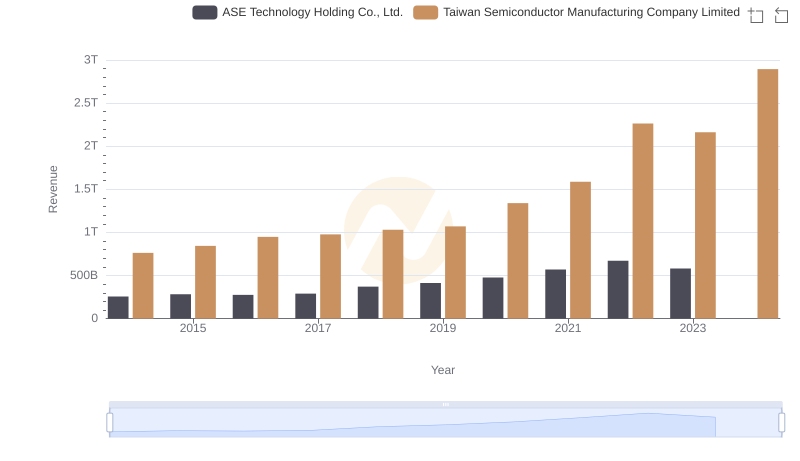
Taiwan Semiconductor Manufacturing Company Limited or ASE Technology Holding Co., Ltd.: Who Leads in Yearly Revenue?
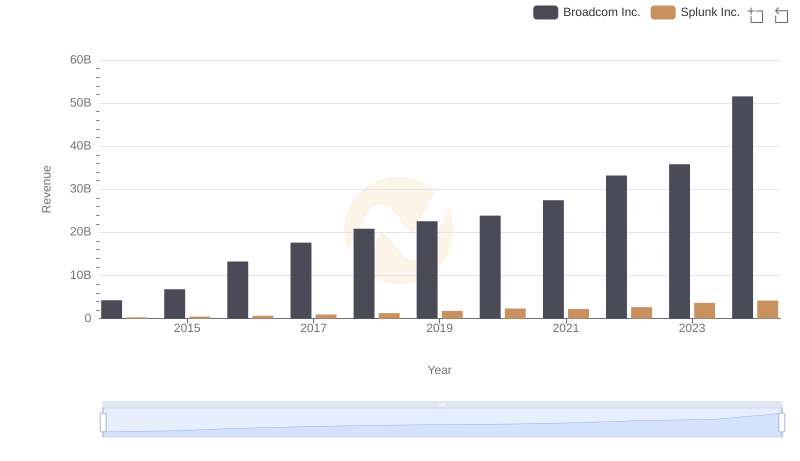
Broadcom Inc. and Splunk Inc.: A Comprehensive Revenue Analysis
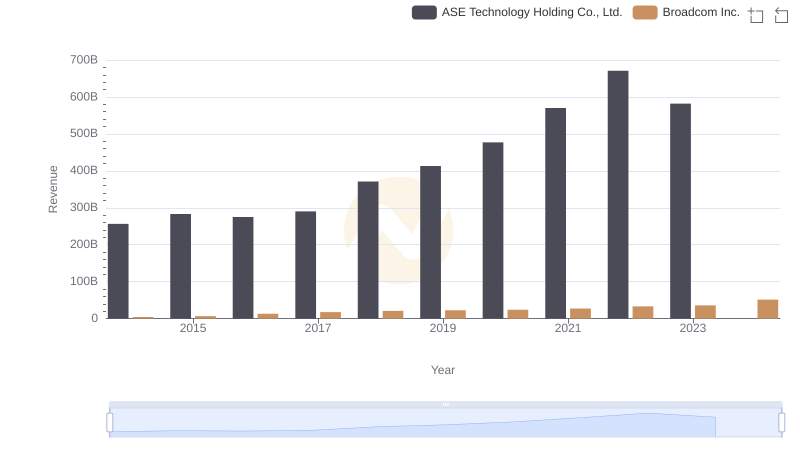
Broadcom Inc. and ASE Technology Holding Co., Ltd.: A Comprehensive Revenue Analysis
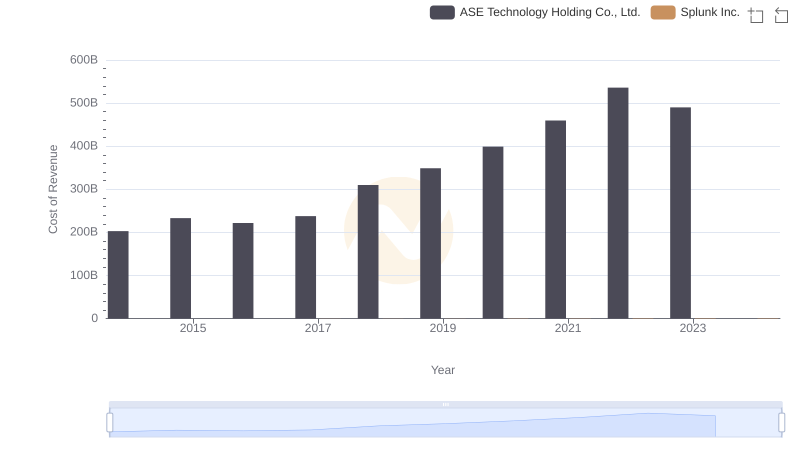
Cost Insights: Breaking Down Splunk Inc. and ASE Technology Holding Co., Ltd.'s Expenses
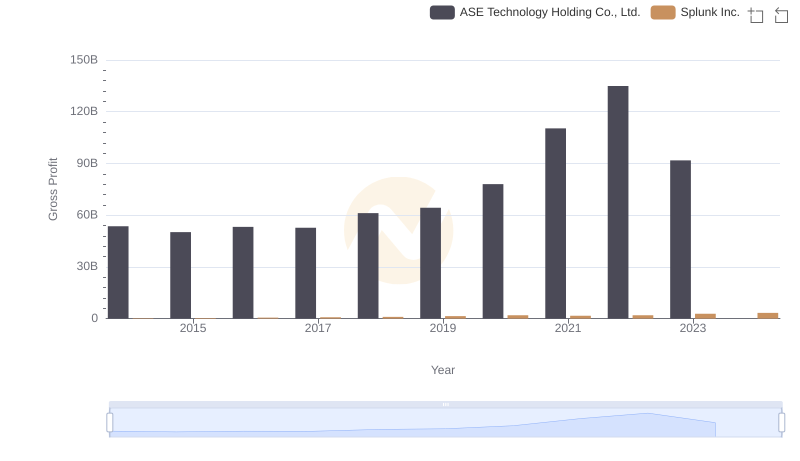
Splunk Inc. and ASE Technology Holding Co., Ltd.: A Detailed Gross Profit Analysis
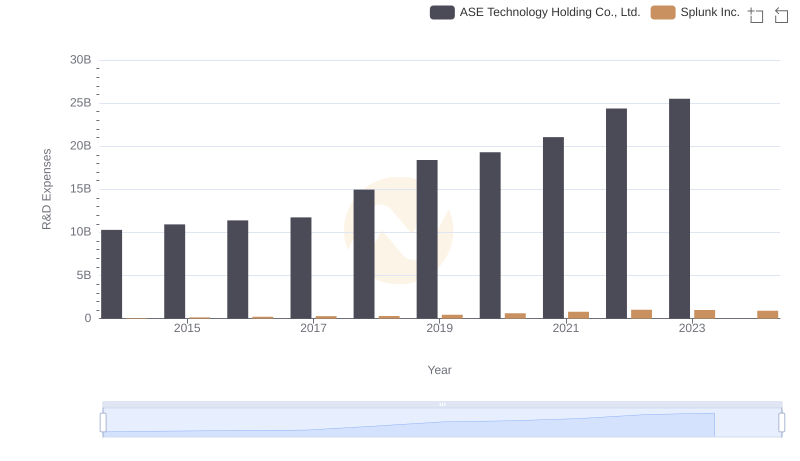
R&D Spending Showdown: Splunk Inc. vs ASE Technology Holding Co., Ltd.
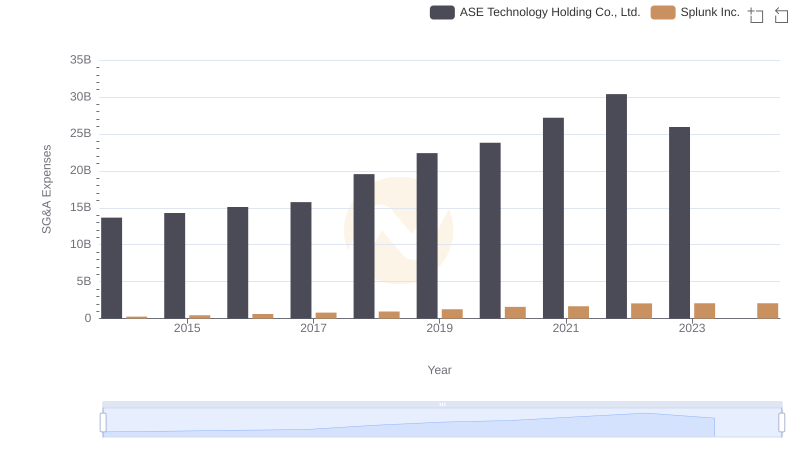
Splunk Inc. and ASE Technology Holding Co., Ltd.: SG&A Spending Patterns Compared