| __timestamp | ASML Holding N.V. | Oracle Corporation |
|---|---|---|
| Wednesday, January 1, 2014 | 318672000 | 8605000000 |
| Thursday, January 1, 2015 | 345700000 | 8732000000 |
| Friday, January 1, 2016 | 374800000 | 9039000000 |
| Sunday, January 1, 2017 | 416600000 | 9299000000 |
| Monday, January 1, 2018 | 488000000 | 9715000000 |
| Tuesday, January 1, 2019 | 520500000 | 9774000000 |
| Wednesday, January 1, 2020 | 544900000 | 9275000000 |
| Friday, January 1, 2021 | 725600000 | 8936000000 |
| Saturday, January 1, 2022 | 909600000 | 9364000000 |
| Sunday, January 1, 2023 | 1113200000 | 10412000000 |
| Monday, January 1, 2024 | 1165700000 | 9822000000 |
In pursuit of knowledge
In the ever-evolving landscape of global technology, understanding the efficiency of Selling, General, and Administrative (SG&A) expenses is crucial. Over the past decade, Oracle Corporation and ASML Holding N.V. have demonstrated contrasting trends in their SG&A expenditures. From 2014 to 2023, Oracle's SG&A expenses have shown a steady increase, peaking at approximately $10.4 billion in 2023, reflecting a 21% rise from 2014. In contrast, ASML's SG&A expenses have surged by over 250%, reaching $1.1 billion in 2023. This stark difference highlights Oracle's consistent yet moderate growth, while ASML's rapid expansion underscores its aggressive market positioning. Notably, the data for 2024 is incomplete, indicating potential shifts in these trends. As these tech giants continue to innovate, their SG&A strategies will play a pivotal role in shaping their competitive edge.
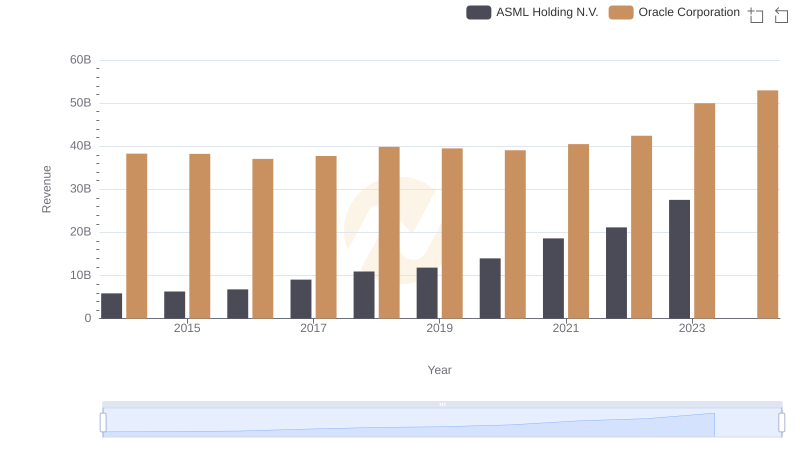
Oracle Corporation vs ASML Holding N.V.: Examining Key Revenue Metrics
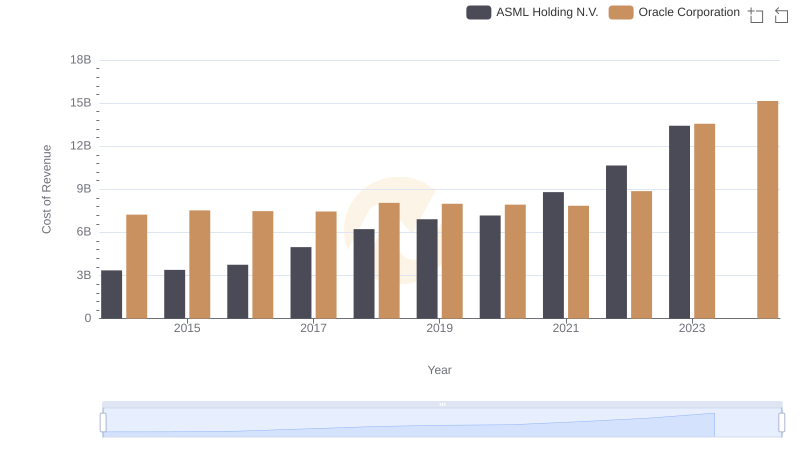
Comparing Cost of Revenue Efficiency: Oracle Corporation vs ASML Holding N.V.
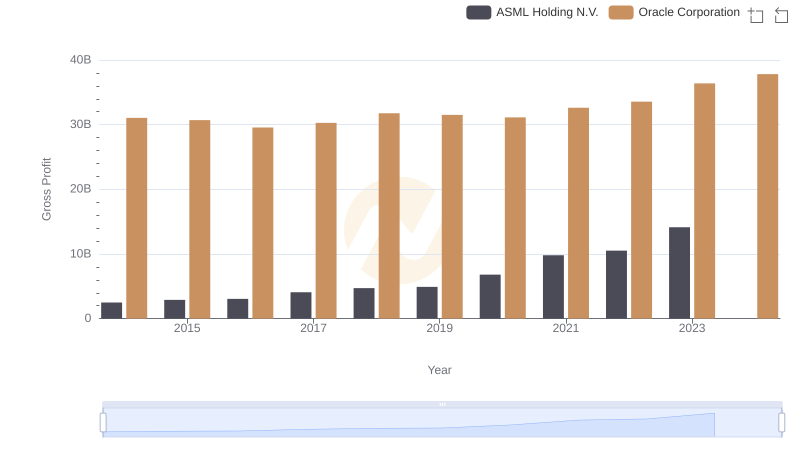
Key Insights on Gross Profit: Oracle Corporation vs ASML Holding N.V.
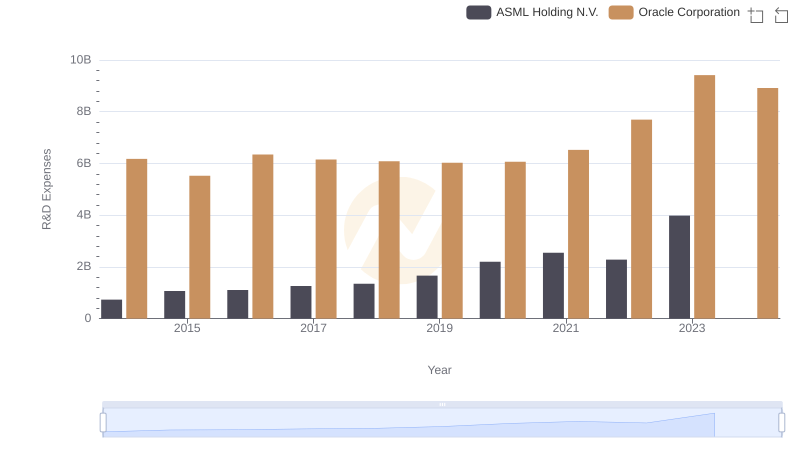
R&D Spending Showdown: Oracle Corporation vs ASML Holding N.V.
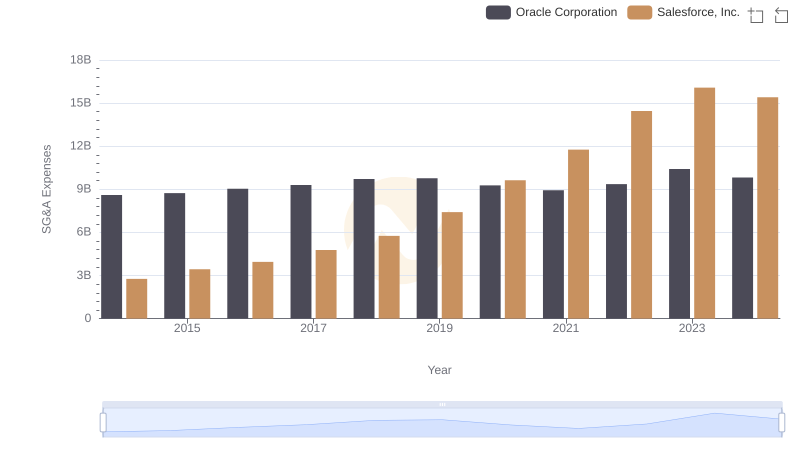
Who Optimizes SG&A Costs Better? Oracle Corporation or Salesforce, Inc.
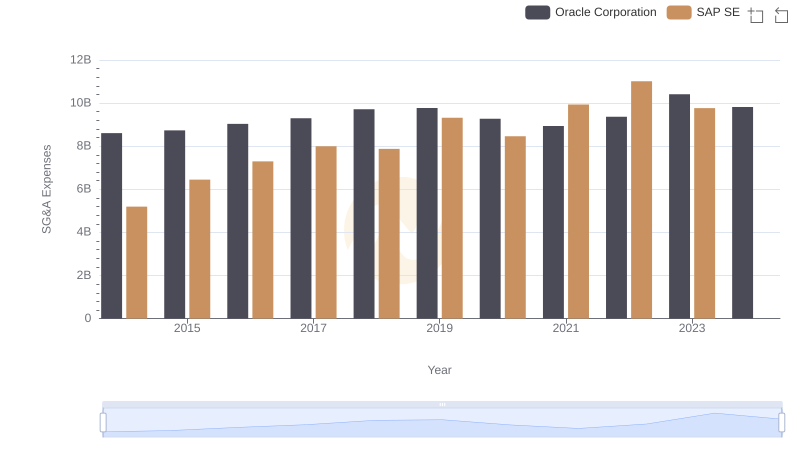
Oracle Corporation vs SAP SE: SG&A Expense Trends
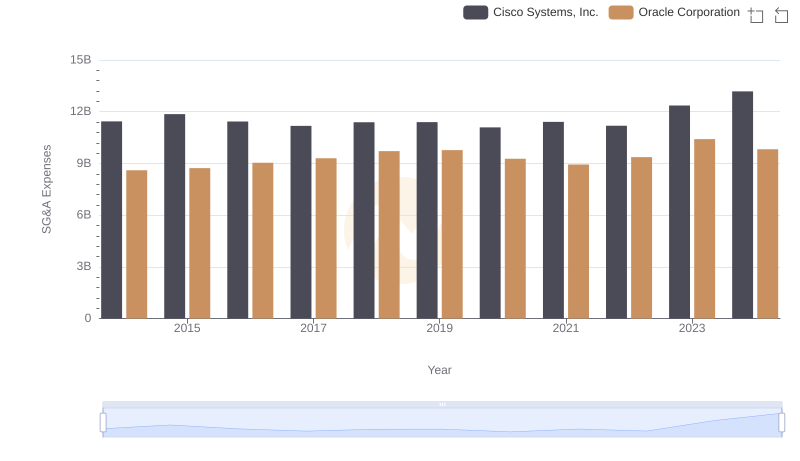
Cost Management Insights: SG&A Expenses for Oracle Corporation and Cisco Systems, Inc.
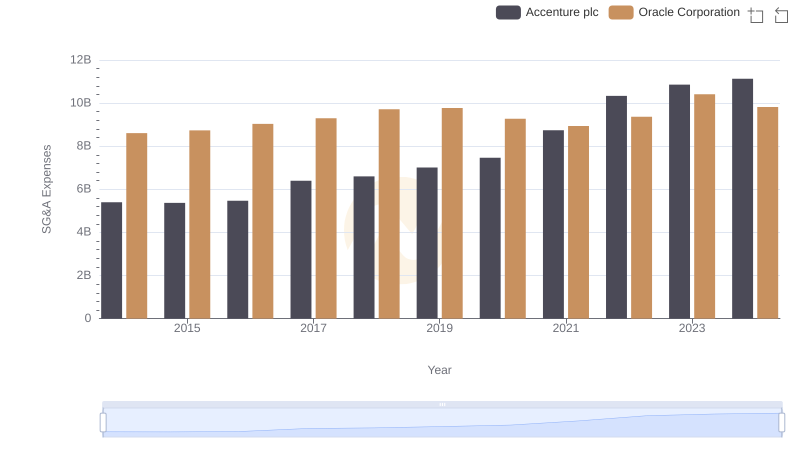
Selling, General, and Administrative Costs: Oracle Corporation vs Accenture plc
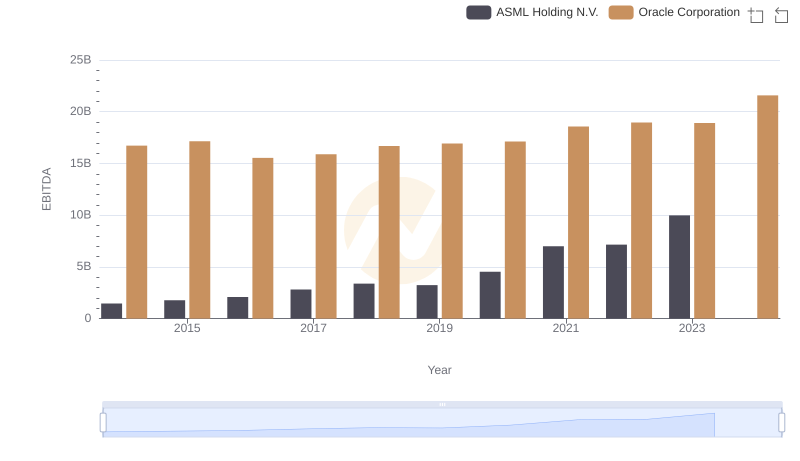
Oracle Corporation and ASML Holding N.V.: A Detailed Examination of EBITDA Performance
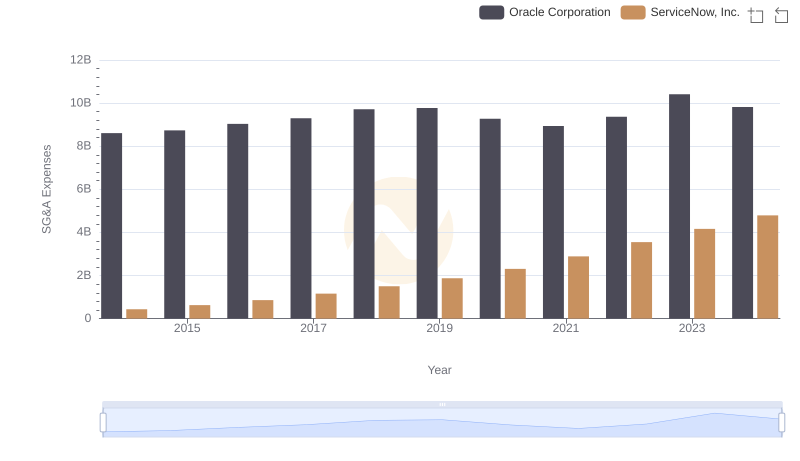
Operational Costs Compared: SG&A Analysis of Oracle Corporation and ServiceNow, Inc.
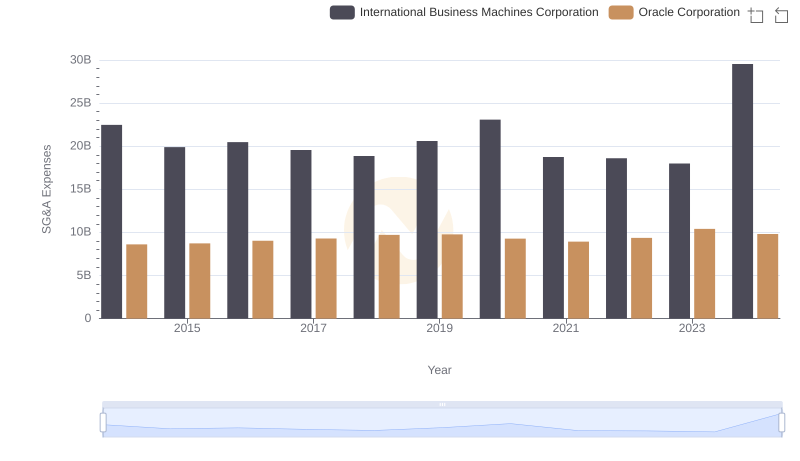
Oracle Corporation or International Business Machines Corporation: Who Manages SG&A Costs Better?
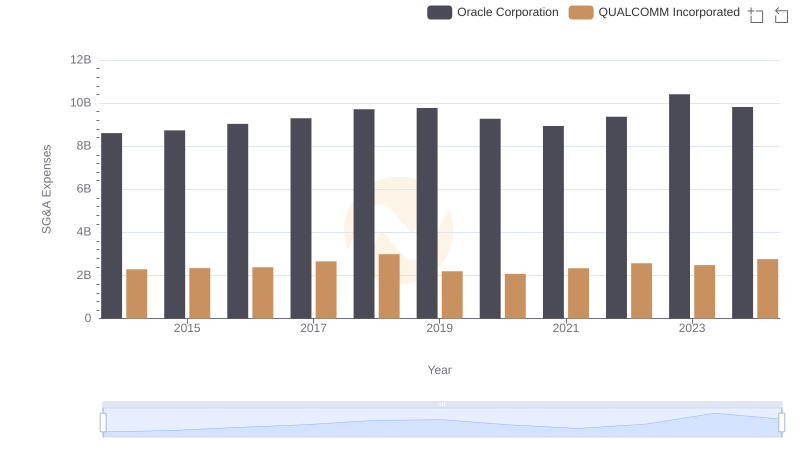
Comparing SG&A Expenses: Oracle Corporation vs QUALCOMM Incorporated Trends and Insights