| __timestamp | Oracle Corporation | SAP SE |
|---|---|---|
| Wednesday, January 1, 2014 | 8605000000 | 5195000000 |
| Thursday, January 1, 2015 | 8732000000 | 6449000000 |
| Friday, January 1, 2016 | 9039000000 | 7299000000 |
| Sunday, January 1, 2017 | 9299000000 | 7999000000 |
| Monday, January 1, 2018 | 9715000000 | 7879000000 |
| Tuesday, January 1, 2019 | 9774000000 | 9318000000 |
| Wednesday, January 1, 2020 | 9275000000 | 8461000000 |
| Friday, January 1, 2021 | 8936000000 | 9936000000 |
| Saturday, January 1, 2022 | 9364000000 | 11015000000 |
| Sunday, January 1, 2023 | 10412000000 | 10192000000 |
| Monday, January 1, 2024 | 9822000000 | 10254000000 |
Unleashing insights
In the ever-evolving landscape of enterprise software, Oracle Corporation and SAP SE have been titans, each with its own strategic approach to growth and management. Over the past decade, from 2014 to 2023, their Selling, General, and Administrative (SG&A) expenses have revealed intriguing insights into their operational strategies.
Oracle's SG&A expenses have shown a steady increase, peaking in 2023 with a 21% rise from 2014. This suggests a robust investment in sales and administrative capabilities, possibly reflecting its aggressive market expansion and customer acquisition strategies. In contrast, SAP's expenses have fluctuated, with a notable 112% increase from 2014 to 2022, before a slight dip in 2023. This volatility might indicate SAP's adaptive strategies in response to market demands and competitive pressures.
Interestingly, 2024 data for SAP is missing, leaving room for speculation on its future trajectory. As these giants continue to innovate, their financial strategies will undoubtedly shape the future of enterprise software.
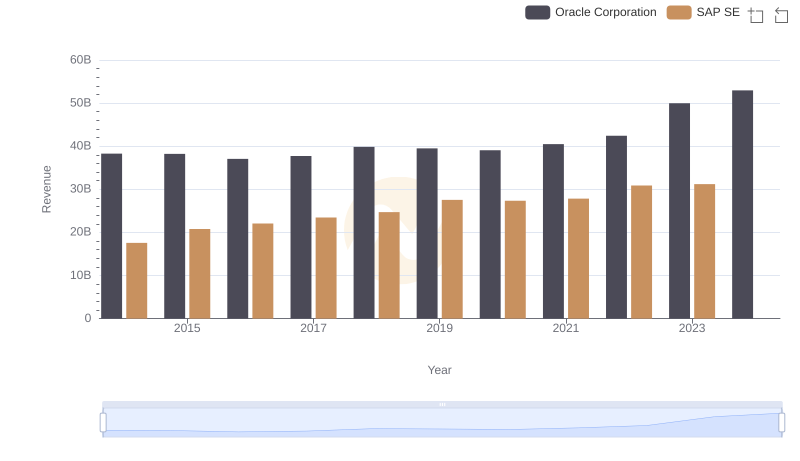
Comparing Revenue Performance: Oracle Corporation or SAP SE?
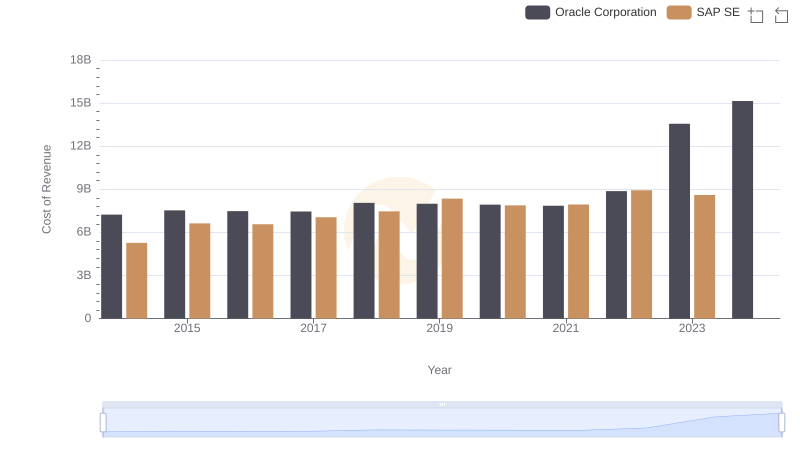
Cost of Revenue Trends: Oracle Corporation vs SAP SE
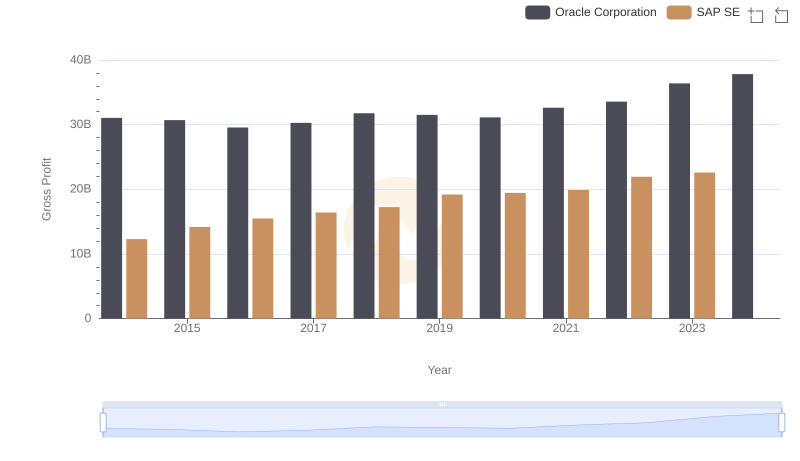
Gross Profit Comparison: Oracle Corporation and SAP SE Trends
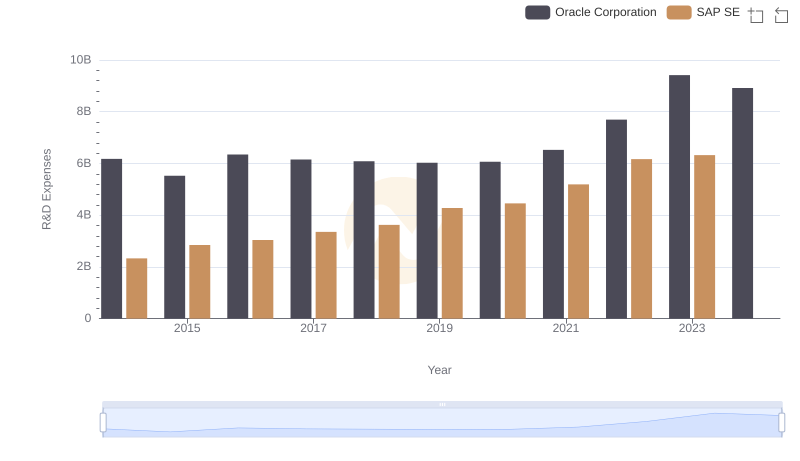
Research and Development: Comparing Key Metrics for Oracle Corporation and SAP SE
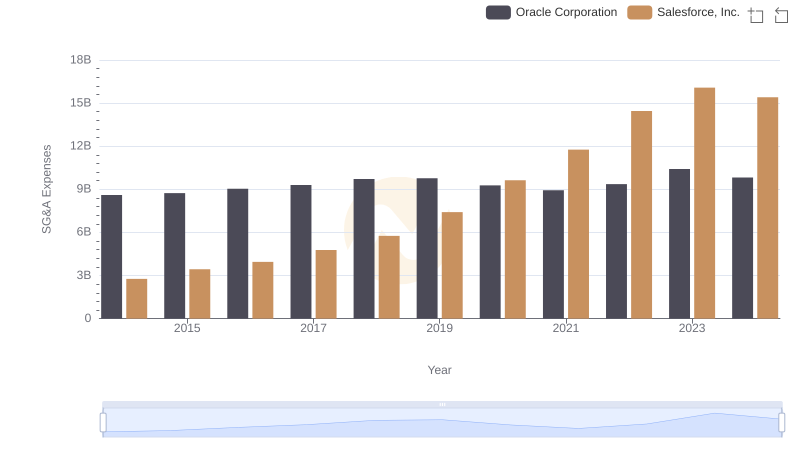
Who Optimizes SG&A Costs Better? Oracle Corporation or Salesforce, Inc.
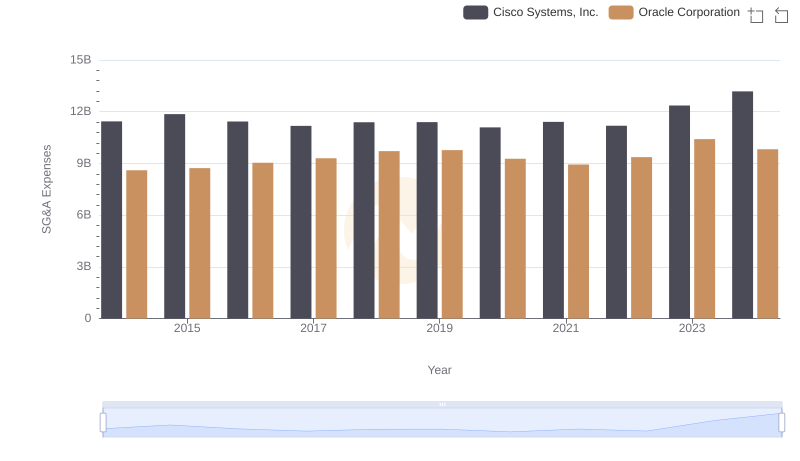
Cost Management Insights: SG&A Expenses for Oracle Corporation and Cisco Systems, Inc.
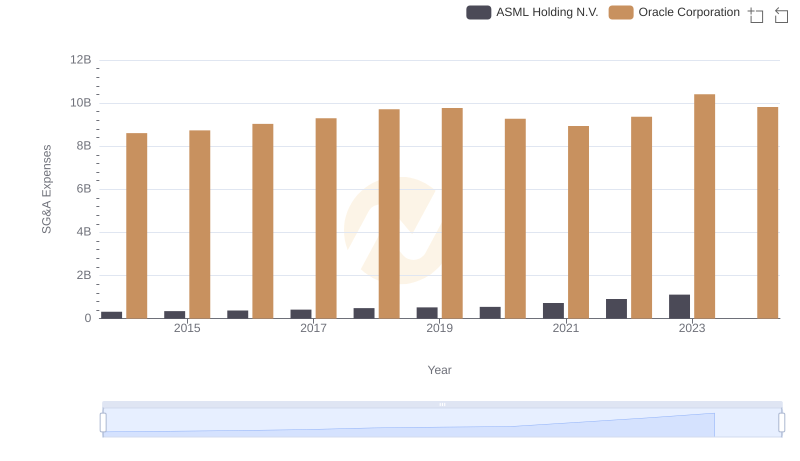
SG&A Efficiency Analysis: Comparing Oracle Corporation and ASML Holding N.V.
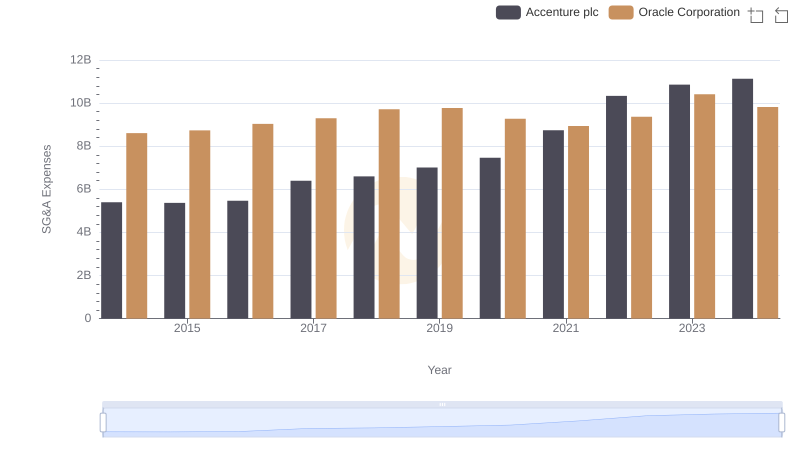
Selling, General, and Administrative Costs: Oracle Corporation vs Accenture plc
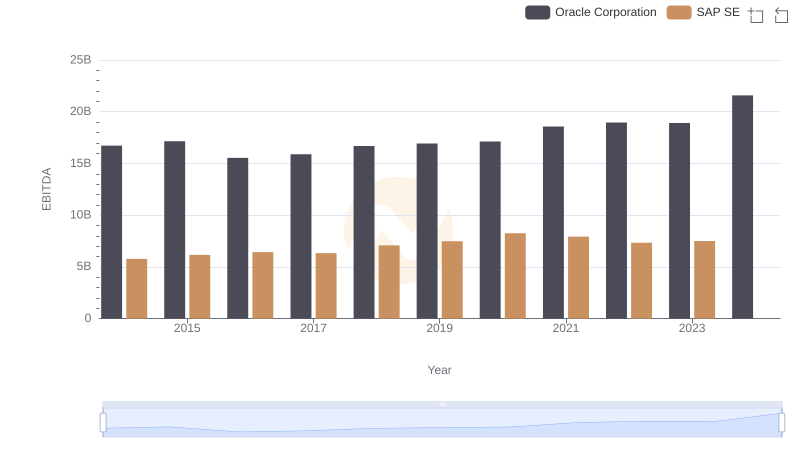
A Side-by-Side Analysis of EBITDA: Oracle Corporation and SAP SE
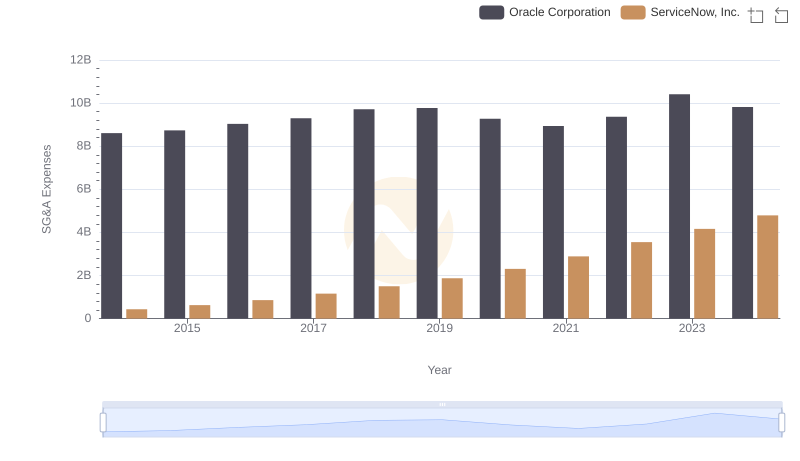
Operational Costs Compared: SG&A Analysis of Oracle Corporation and ServiceNow, Inc.
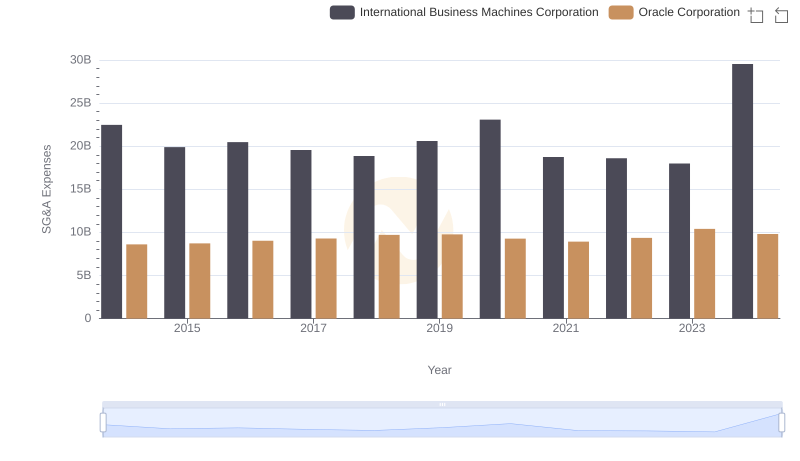
Oracle Corporation or International Business Machines Corporation: Who Manages SG&A Costs Better?
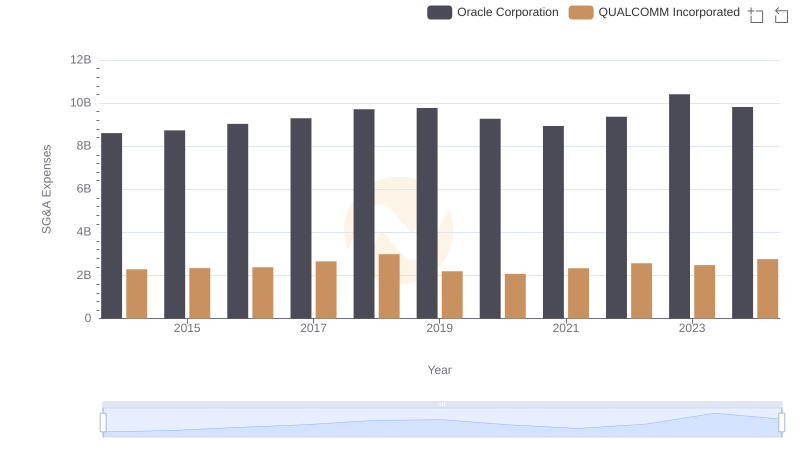
Comparing SG&A Expenses: Oracle Corporation vs QUALCOMM Incorporated Trends and Insights