| __timestamp | Infosys Limited | Zebra Technologies Corporation |
|---|---|---|
| Wednesday, January 1, 2014 | 1079000000 | 351518000 |
| Thursday, January 1, 2015 | 1176000000 | 763025000 |
| Friday, January 1, 2016 | 1020000000 | 751000000 |
| Sunday, January 1, 2017 | 1279000000 | 749000000 |
| Monday, January 1, 2018 | 1220000000 | 811000000 |
| Tuesday, January 1, 2019 | 1504000000 | 826000000 |
| Wednesday, January 1, 2020 | 1223000000 | 787000000 |
| Friday, January 1, 2021 | 1391000000 | 935000000 |
| Saturday, January 1, 2022 | 1678000000 | 982000000 |
| Sunday, January 1, 2023 | 1632000000 | 915000000 |
| Monday, January 1, 2024 | 981000000 |
Unlocking the unknown
In the ever-evolving landscape of global business, understanding the efficiency of Selling, General, and Administrative (SG&A) expenses is crucial. This analysis compares Infosys Limited and Zebra Technologies Corporation over a decade, from 2014 to 2023. Infosys, a titan in the IT services sector, consistently outpaced Zebra Technologies, a leader in enterprise asset intelligence, in SG&A spending. Notably, Infosys's SG&A expenses grew by approximately 51% from 2014 to 2023, peaking in 2022. In contrast, Zebra Technologies saw a 160% increase in the same period, highlighting a more aggressive expansion strategy. The data reveals that while Infosys maintained a steady growth trajectory, Zebra's expenses surged, particularly between 2015 and 2016, reflecting strategic investments. This comparison underscores the diverse approaches these companies take in managing operational costs, offering valuable insights into their strategic priorities.
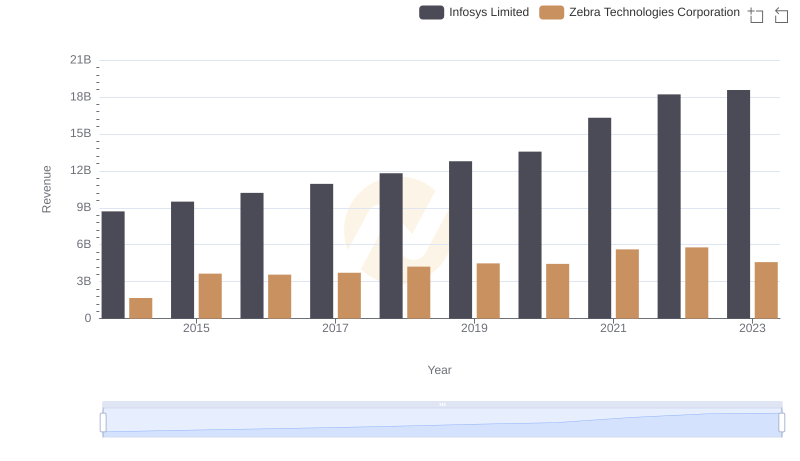
Revenue Showdown: Infosys Limited vs Zebra Technologies Corporation
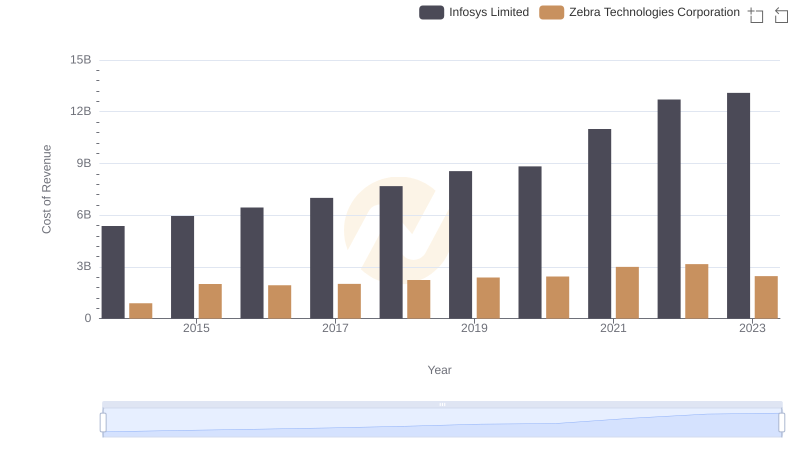
Cost Insights: Breaking Down Infosys Limited and Zebra Technologies Corporation's Expenses
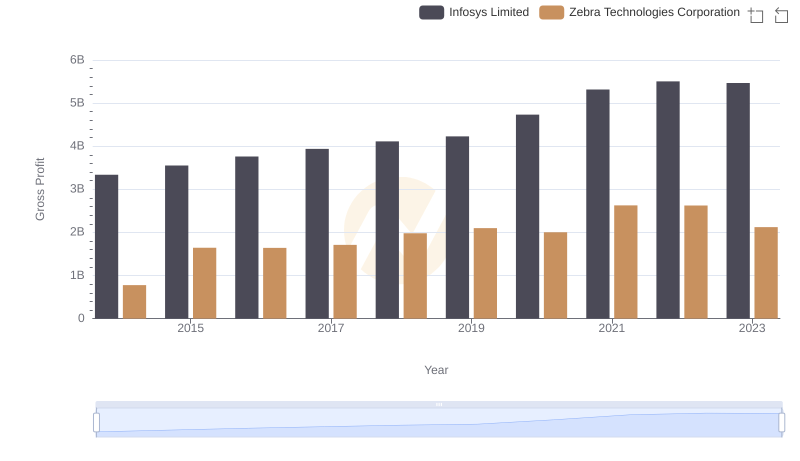
Infosys Limited vs Zebra Technologies Corporation: A Gross Profit Performance Breakdown
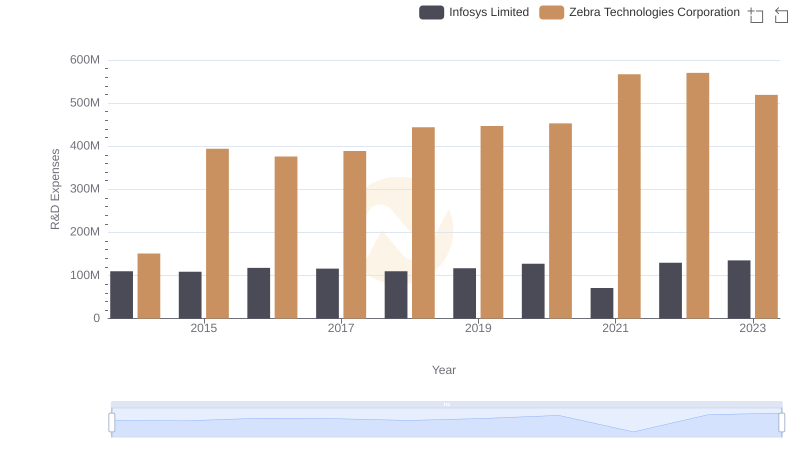
Research and Development Investment: Infosys Limited vs Zebra Technologies Corporation
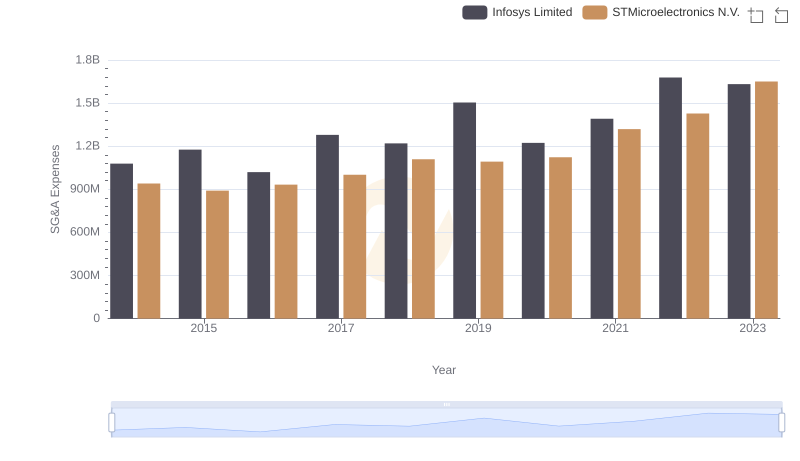
Infosys Limited or STMicroelectronics N.V.: Who Manages SG&A Costs Better?
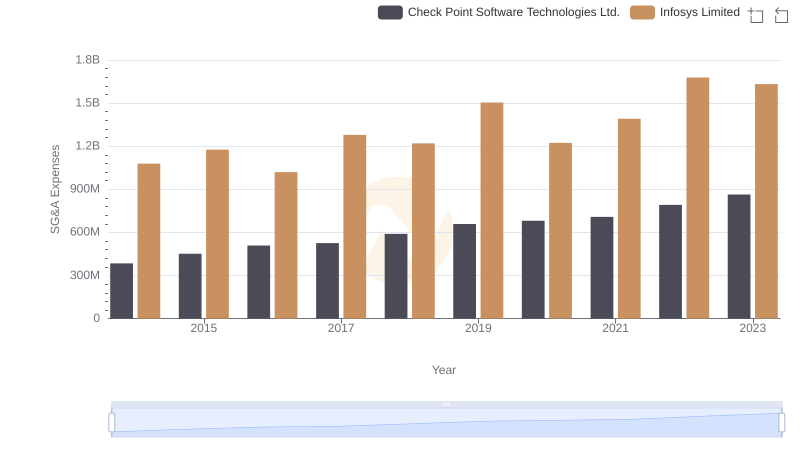
Who Optimizes SG&A Costs Better? Infosys Limited or Check Point Software Technologies Ltd.
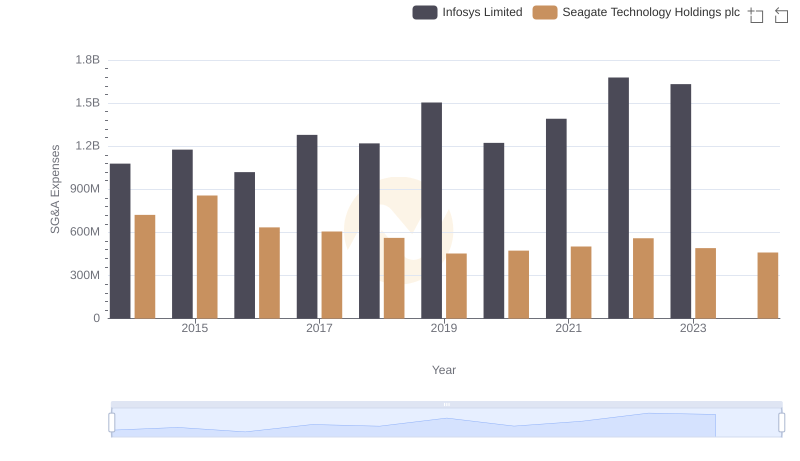
Infosys Limited or Seagate Technology Holdings plc: Who Manages SG&A Costs Better?
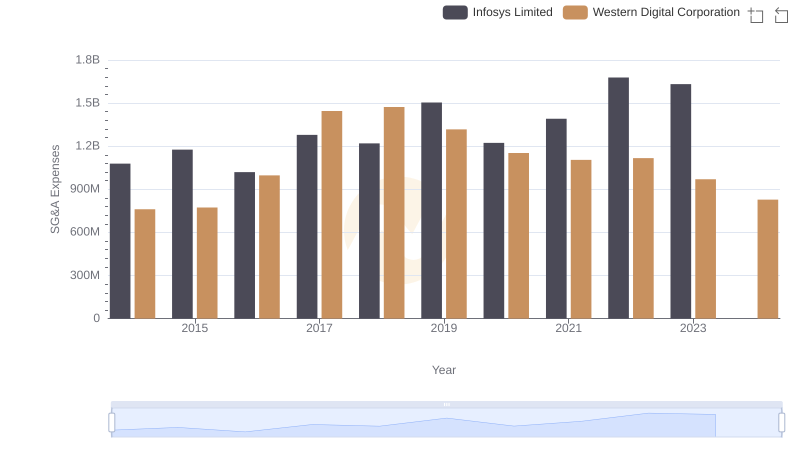
Who Optimizes SG&A Costs Better? Infosys Limited or Western Digital Corporation
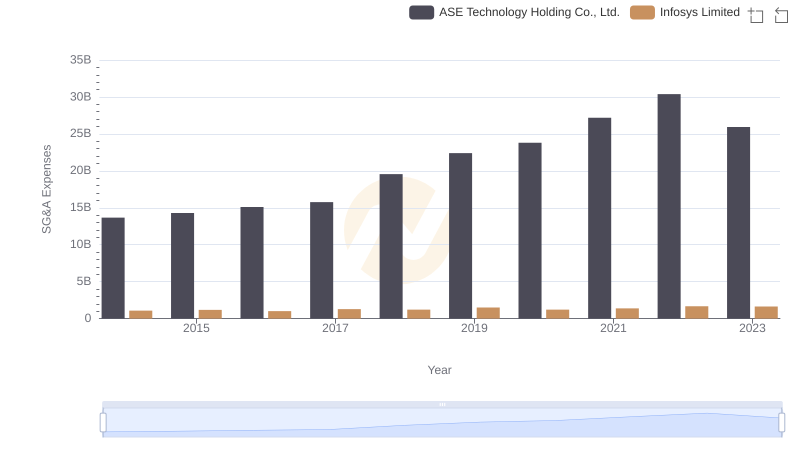
Selling, General, and Administrative Costs: Infosys Limited vs ASE Technology Holding Co., Ltd.
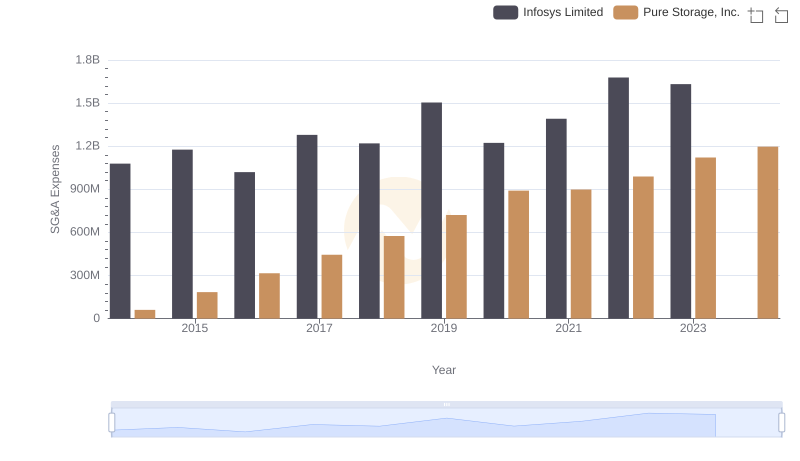
Infosys Limited and Pure Storage, Inc.: SG&A Spending Patterns Compared
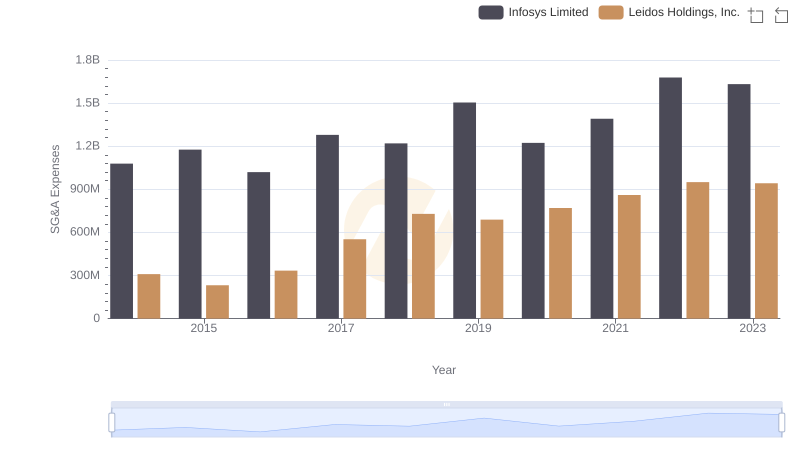
SG&A Efficiency Analysis: Comparing Infosys Limited and Leidos Holdings, Inc.
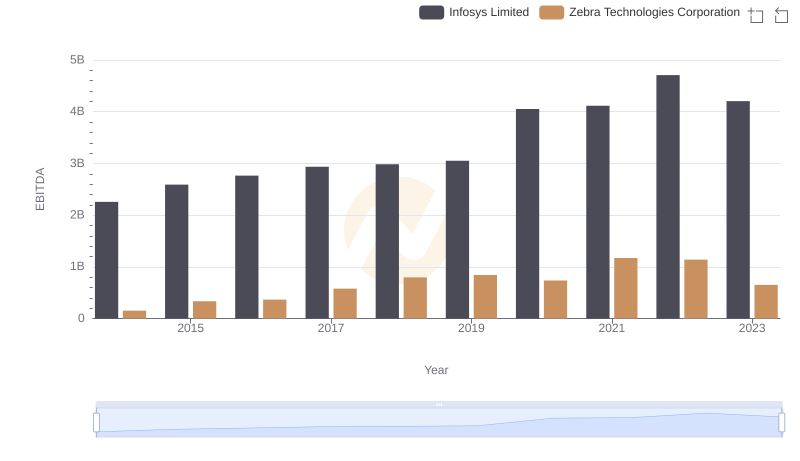
Comprehensive EBITDA Comparison: Infosys Limited vs Zebra Technologies Corporation