| __timestamp | AMETEK, Inc. | Waste Connections, Inc. |
|---|---|---|
| Wednesday, January 1, 2014 | 462637000 | 229474000 |
| Thursday, January 1, 2015 | 448592000 | 237484000 |
| Friday, January 1, 2016 | 462970000 | 474263000 |
| Sunday, January 1, 2017 | 533645000 | 509638000 |
| Monday, January 1, 2018 | 584022000 | 524388000 |
| Tuesday, January 1, 2019 | 610280000 | 546278000 |
| Wednesday, January 1, 2020 | 515630000 | 537632000 |
| Friday, January 1, 2021 | 603944000 | 612337000 |
| Saturday, January 1, 2022 | 644577000 | 696467000 |
| Sunday, January 1, 2023 | 677006000 | 799119000 |
| Monday, January 1, 2024 | 696905000 | 883445000 |
Infusing magic into the data realm
In the ever-evolving landscape of corporate finance, understanding the nuances of Selling, General, and Administrative (SG&A) expenses is crucial. Over the past decade, Waste Connections, Inc. and AMETEK, Inc. have demonstrated intriguing trends in their SG&A expenditures. From 2014 to 2023, AMETEK, Inc. saw a steady increase in SG&A costs, rising approximately 46% from 2014 to 2023. Meanwhile, Waste Connections, Inc. experienced a more dramatic surge, with expenses nearly tripling over the same period.
This divergence highlights the differing strategic priorities and operational scales of these two industry giants. By 2023, Waste Connections, Inc.'s SG&A expenses surpassed AMETEK, Inc.'s by about 18%, reflecting its aggressive expansion and market penetration strategies. As businesses navigate the complexities of financial management, these insights offer valuable lessons in balancing growth with operational efficiency.
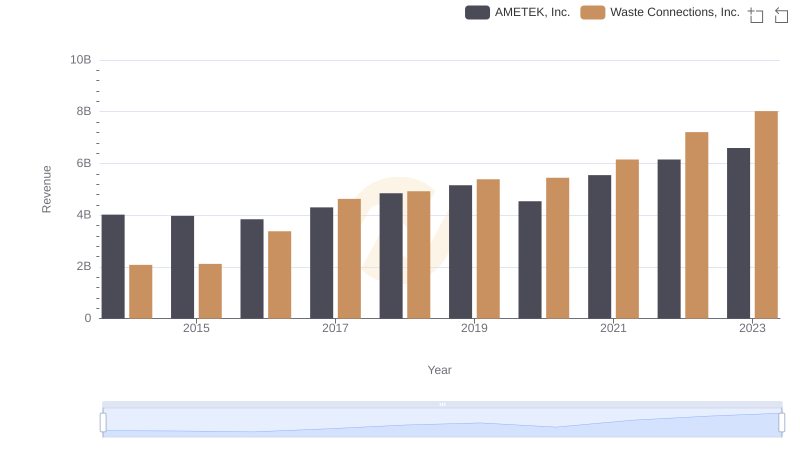
Revenue Insights: Waste Connections, Inc. and AMETEK, Inc. Performance Compared
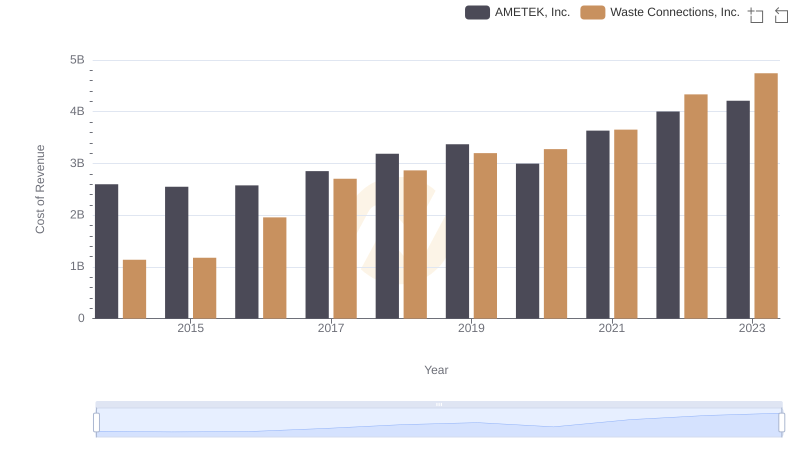
Cost of Revenue: Key Insights for Waste Connections, Inc. and AMETEK, Inc.
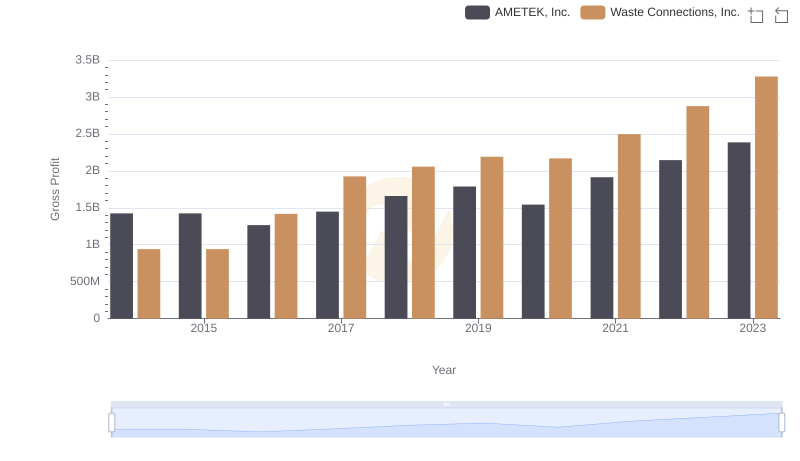
Waste Connections, Inc. vs AMETEK, Inc.: A Gross Profit Performance Breakdown
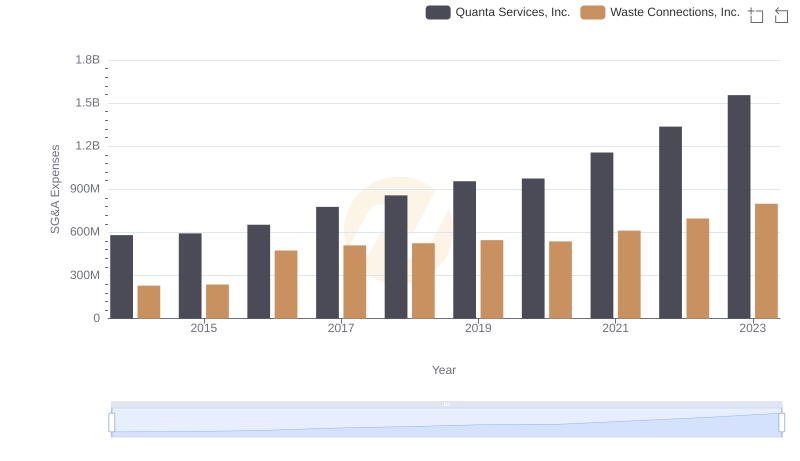
Waste Connections, Inc. vs Quanta Services, Inc.: SG&A Expense Trends
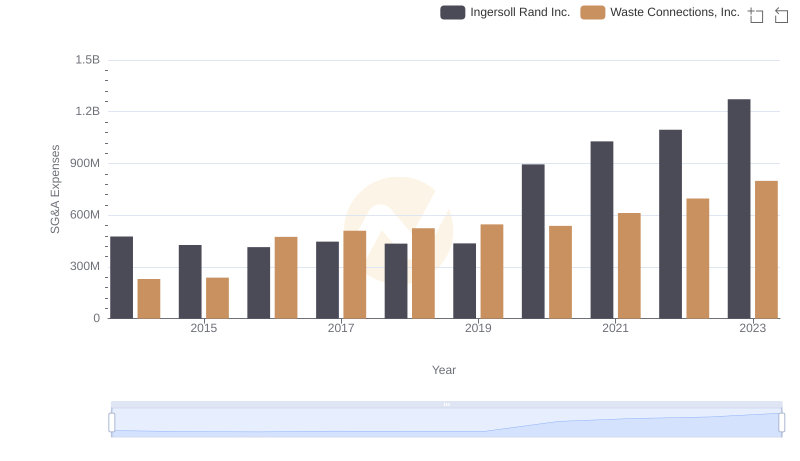
Who Optimizes SG&A Costs Better? Waste Connections, Inc. or Ingersoll Rand Inc.
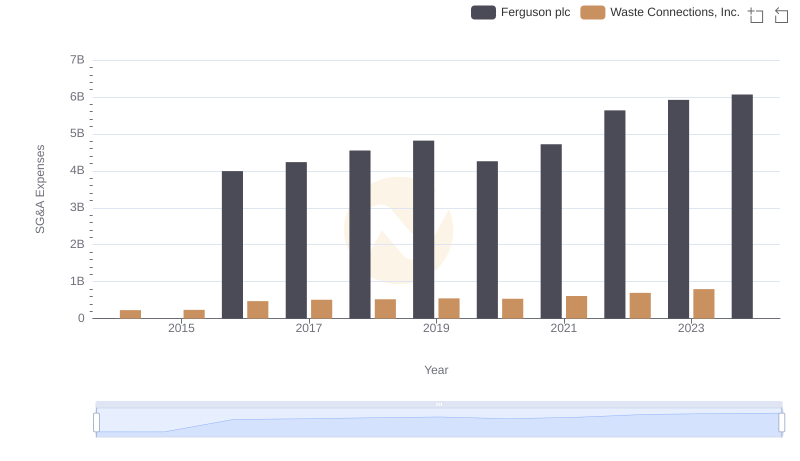
Waste Connections, Inc. or Ferguson plc: Who Manages SG&A Costs Better?