| __timestamp | Broadridge Financial Solutions, Inc. | Splunk Inc. |
|---|---|---|
| Wednesday, January 1, 2014 | 376000000 | 269210000 |
| Thursday, January 1, 2015 | 396800000 | 447517000 |
| Friday, January 1, 2016 | 420900000 | 626927000 |
| Sunday, January 1, 2017 | 501400000 | 806883000 |
| Monday, January 1, 2018 | 565400000 | 967560000 |
| Tuesday, January 1, 2019 | 577500000 | 1267538000 |
| Wednesday, January 1, 2020 | 639000000 | 1596475000 |
| Friday, January 1, 2021 | 744300000 | 1671200000 |
| Saturday, January 1, 2022 | 832300000 | 2056950000 |
| Sunday, January 1, 2023 | 849000000 | 2076049000 |
| Monday, January 1, 2024 | 916800000 | 2074630000 |
Unveiling the hidden dimensions of data
In the ever-evolving landscape of financial technology, understanding the cost structures of industry leaders is crucial. Over the past decade, Broadridge Financial Solutions, Inc. and Splunk Inc. have demonstrated contrasting trends in their Selling, General, and Administrative (SG&A) expenses. From 2014 to 2024, Broadridge's SG&A expenses have grown steadily, increasing by approximately 144%, reflecting a consistent investment in operational efficiency and market expansion. In contrast, Splunk's SG&A expenses surged by nearly 670% during the same period, highlighting its aggressive growth strategy and market penetration efforts.
These insights provide a window into the strategic priorities of these fintech giants, offering valuable lessons for investors and industry analysts alike.
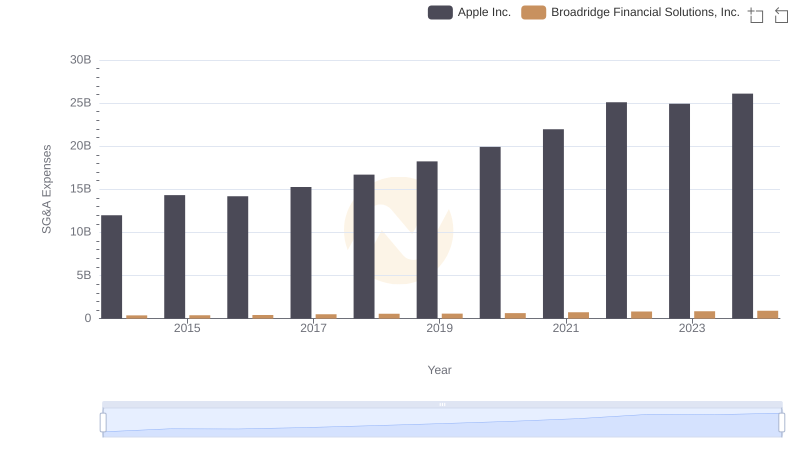
Apple Inc. vs Broadridge Financial Solutions, Inc.: SG&A Expense Trends
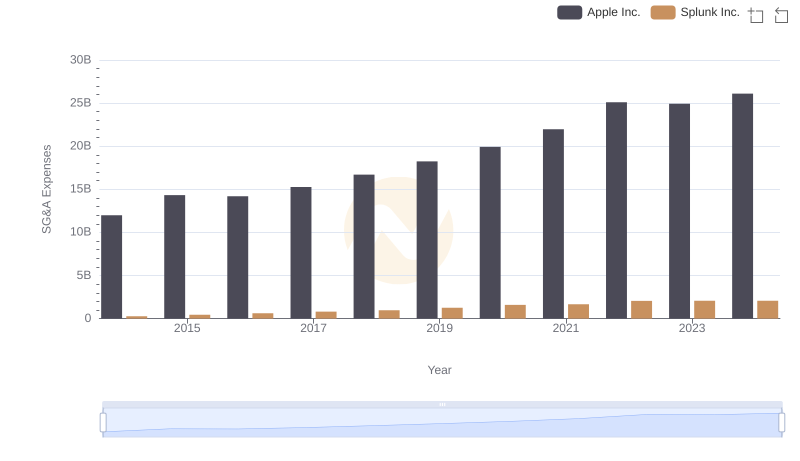
Operational Costs Compared: SG&A Analysis of Apple Inc. and Splunk Inc.
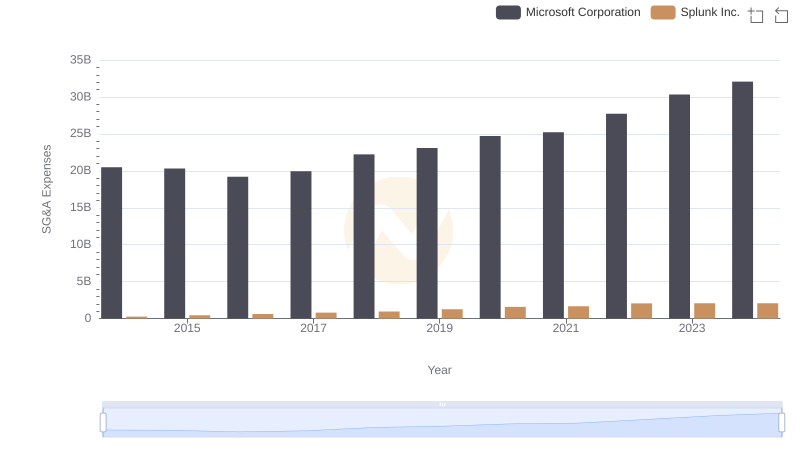
Microsoft Corporation vs Splunk Inc.: SG&A Expense Trends
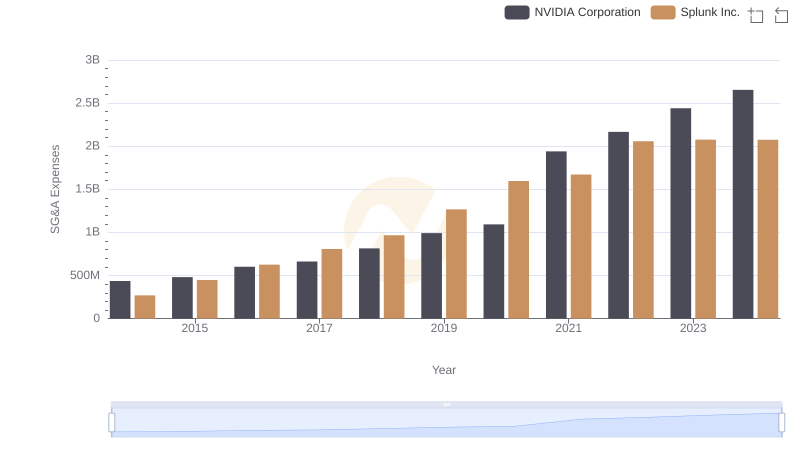
Comparing SG&A Expenses: NVIDIA Corporation vs Splunk Inc. Trends and Insights
Operational Costs Compared: SG&A Analysis of Taiwan Semiconductor Manufacturing Company Limited and Broadridge Financial Solutions, Inc.
Operational Costs Compared: SG&A Analysis of Taiwan Semiconductor Manufacturing Company Limited and Splunk Inc.
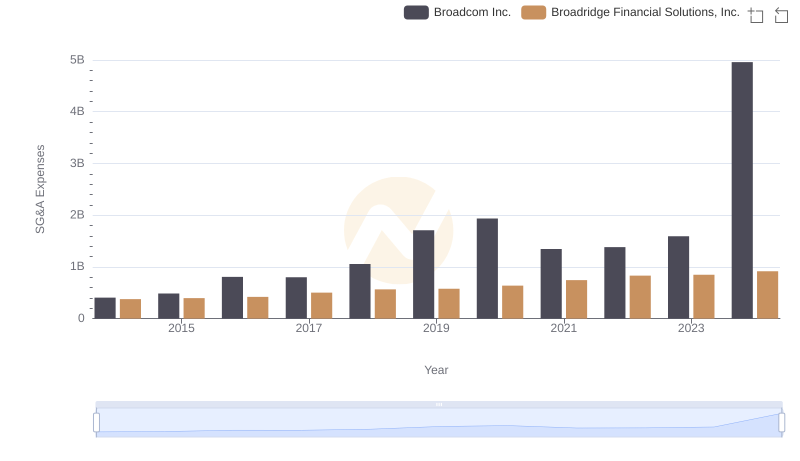
Who Optimizes SG&A Costs Better? Broadcom Inc. or Broadridge Financial Solutions, Inc.
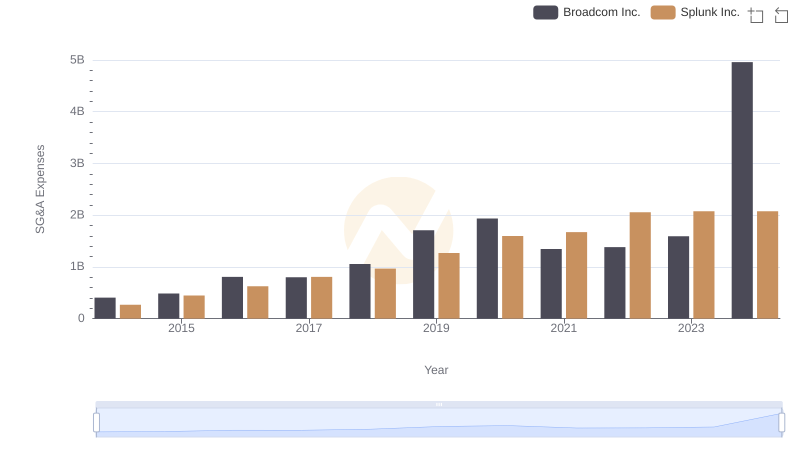
Breaking Down SG&A Expenses: Broadcom Inc. vs Splunk Inc.
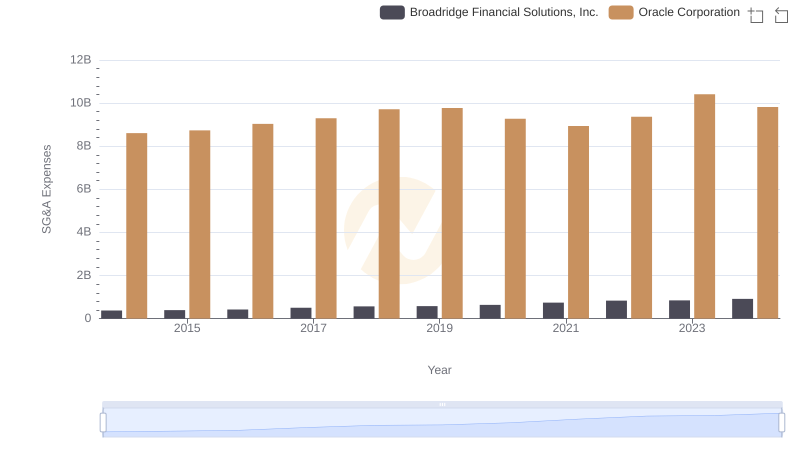
Oracle Corporation vs Broadridge Financial Solutions, Inc.: SG&A Expense Trends
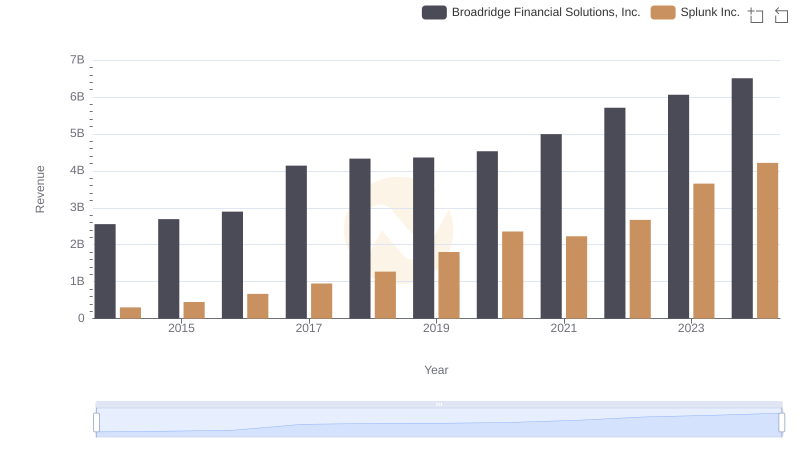
Broadridge Financial Solutions, Inc. or Splunk Inc.: Who Leads in Yearly Revenue?
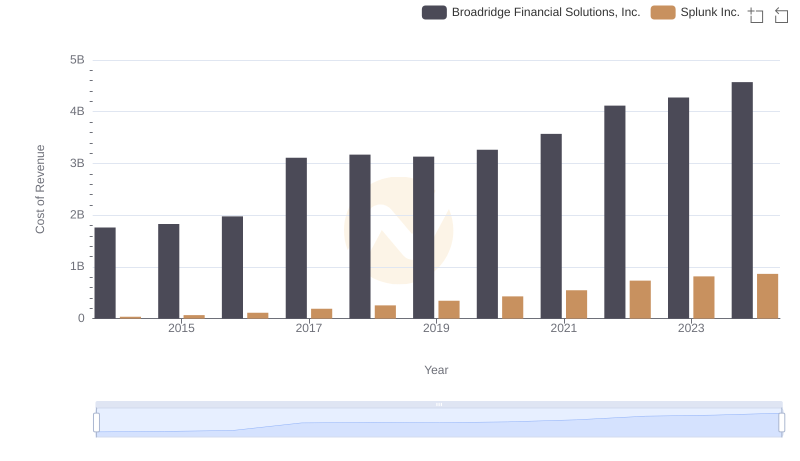
Cost of Revenue Comparison: Broadridge Financial Solutions, Inc. vs Splunk Inc.
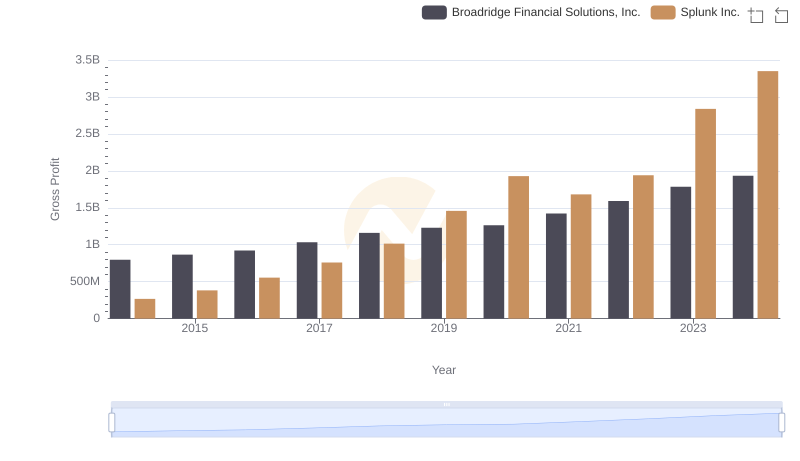
Key Insights on Gross Profit: Broadridge Financial Solutions, Inc. vs Splunk Inc.