| __timestamp | Broadridge Financial Solutions, Inc. | Splunk Inc. |
|---|---|---|
| Wednesday, January 1, 2014 | 796600000 | 266798000 |
| Thursday, January 1, 2015 | 866000000 | 382497000 |
| Friday, January 1, 2016 | 921100000 | 554313000 |
| Sunday, January 1, 2017 | 1033000000 | 758902000 |
| Monday, January 1, 2018 | 1160300000 | 1014379000 |
| Tuesday, January 1, 2019 | 1230300000 | 1458334000 |
| Wednesday, January 1, 2020 | 1263900000 | 1929138000 |
| Friday, January 1, 2021 | 1422900000 | 1682040000 |
| Saturday, January 1, 2022 | 1592200000 | 1939695000 |
| Sunday, January 1, 2023 | 1785400000 | 2837713000 |
| Monday, January 1, 2024 | 1933900000 | 3350088000 |
Unveiling the hidden dimensions of data
In the ever-evolving landscape of financial technology, Broadridge Financial Solutions, Inc. and Splunk Inc. have emerged as key players. Over the past decade, from 2014 to 2024, both companies have demonstrated impressive growth in gross profit, reflecting their strategic prowess and market adaptability.
Broadridge Financial Solutions, Inc. has seen its gross profit nearly double, starting from approximately $800 million in 2014 to an impressive $1.9 billion in 2024. This steady growth underscores Broadridge's robust business model and its ability to capitalize on market opportunities.
Meanwhile, Splunk Inc. has experienced a remarkable surge, with its gross profit increasing more than twelvefold, from around $267 million in 2014 to a staggering $3.35 billion in 2024. This exponential growth highlights Splunk's innovative approach and its pivotal role in the data analytics sector.
Both companies exemplify the dynamic nature of the financial technology industry, showcasing resilience and innovation in a competitive market.
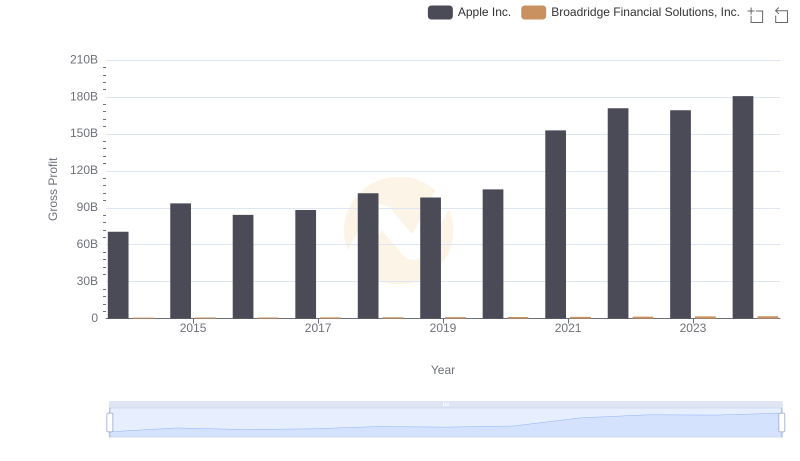
Gross Profit Comparison: Apple Inc. and Broadridge Financial Solutions, Inc. Trends
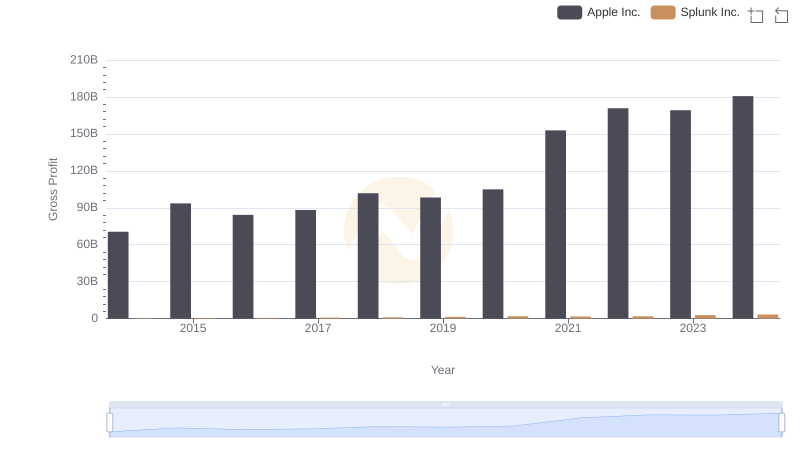
Gross Profit Analysis: Comparing Apple Inc. and Splunk Inc.
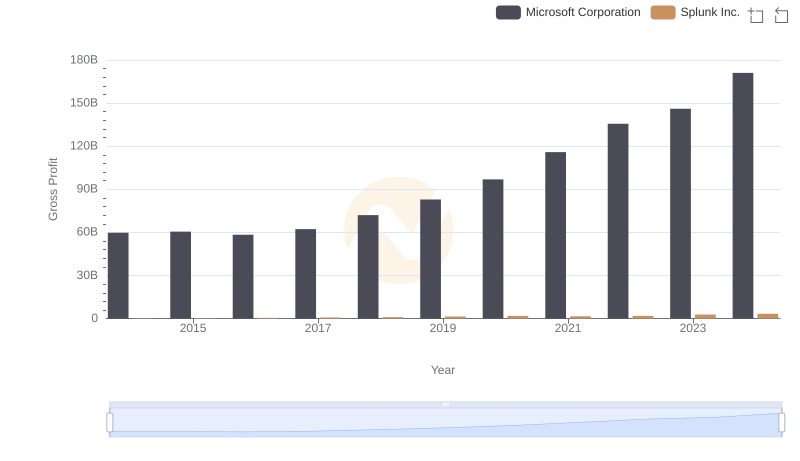
Gross Profit Analysis: Comparing Microsoft Corporation and Splunk Inc.
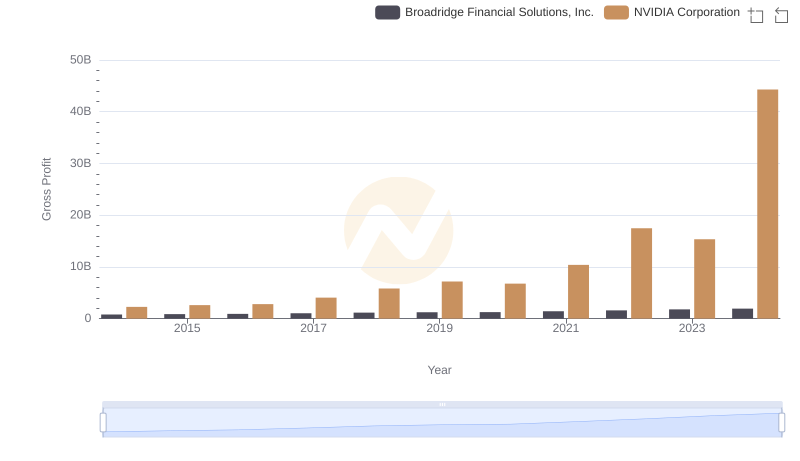
Key Insights on Gross Profit: NVIDIA Corporation vs Broadridge Financial Solutions, Inc.
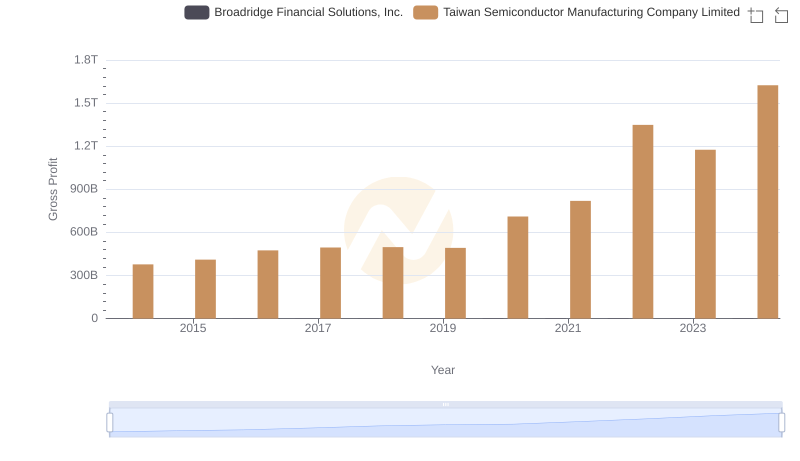
Gross Profit Trends Compared: Taiwan Semiconductor Manufacturing Company Limited vs Broadridge Financial Solutions, Inc.
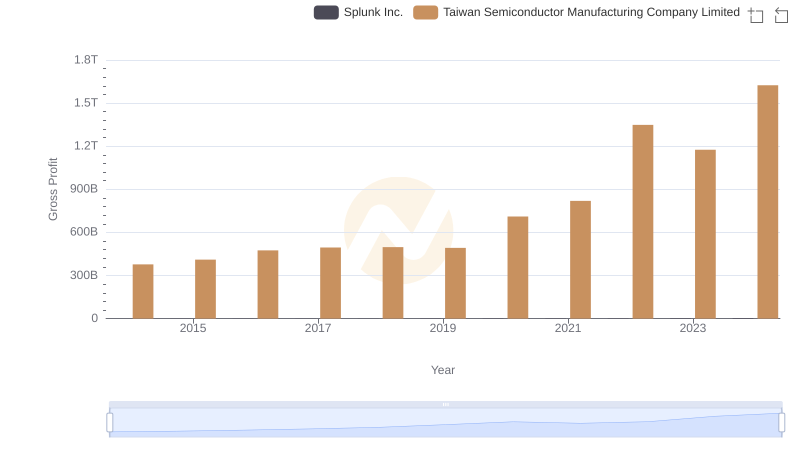
Who Generates Higher Gross Profit? Taiwan Semiconductor Manufacturing Company Limited or Splunk Inc.
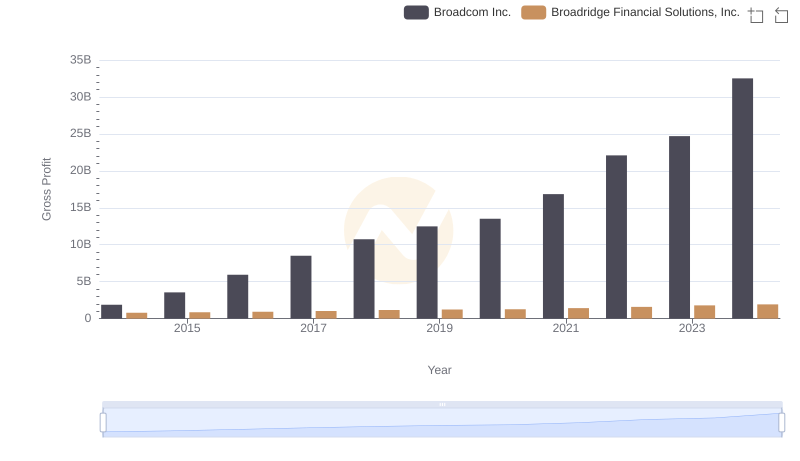
Gross Profit Comparison: Broadcom Inc. and Broadridge Financial Solutions, Inc. Trends
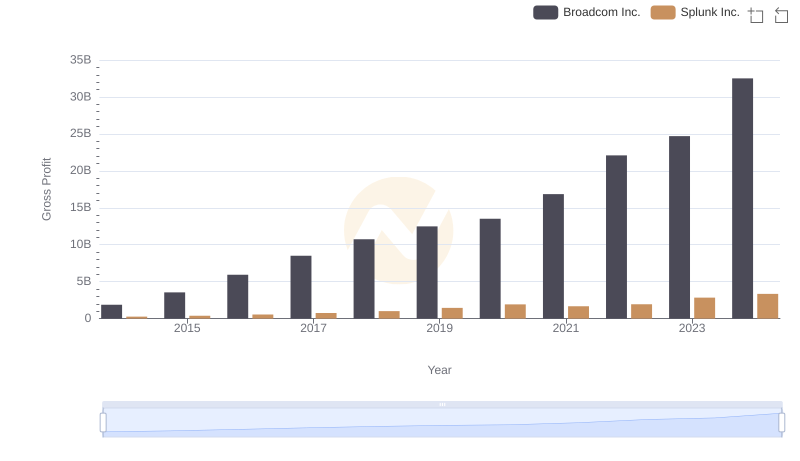
Broadcom Inc. and Splunk Inc.: A Detailed Gross Profit Analysis
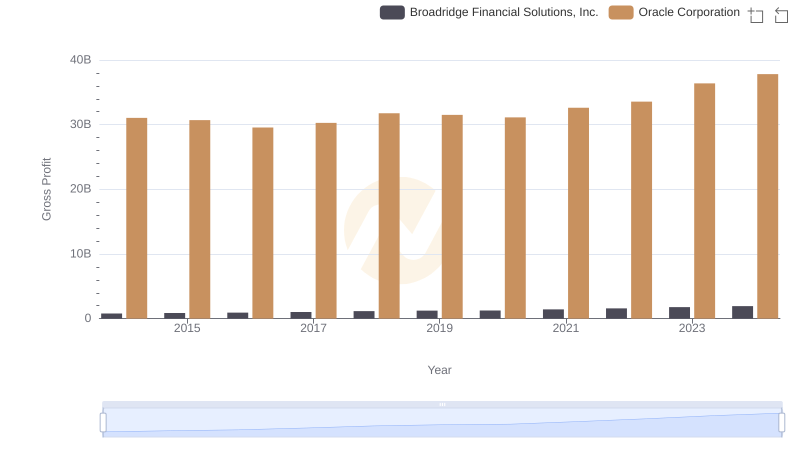
Gross Profit Comparison: Oracle Corporation and Broadridge Financial Solutions, Inc. Trends
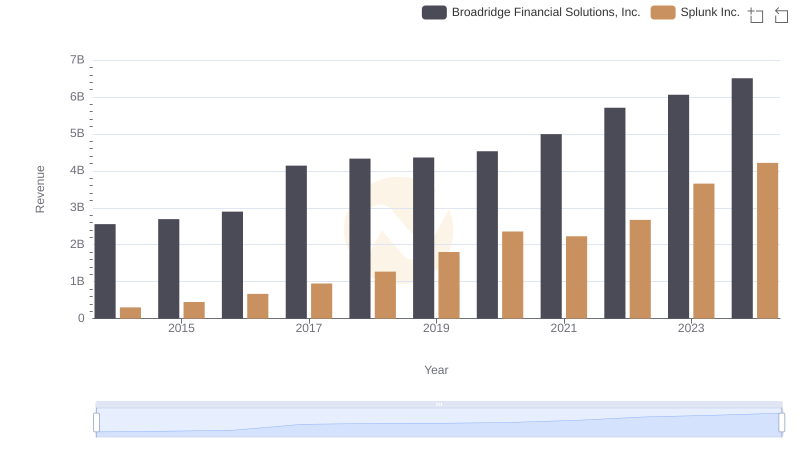
Broadridge Financial Solutions, Inc. or Splunk Inc.: Who Leads in Yearly Revenue?
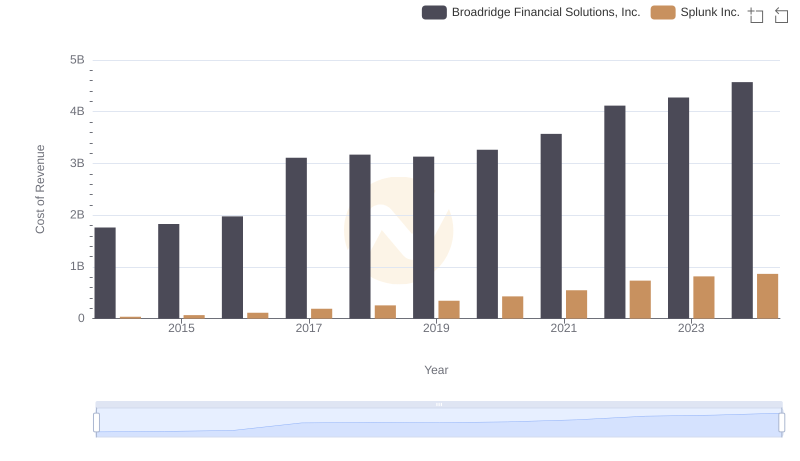
Cost of Revenue Comparison: Broadridge Financial Solutions, Inc. vs Splunk Inc.
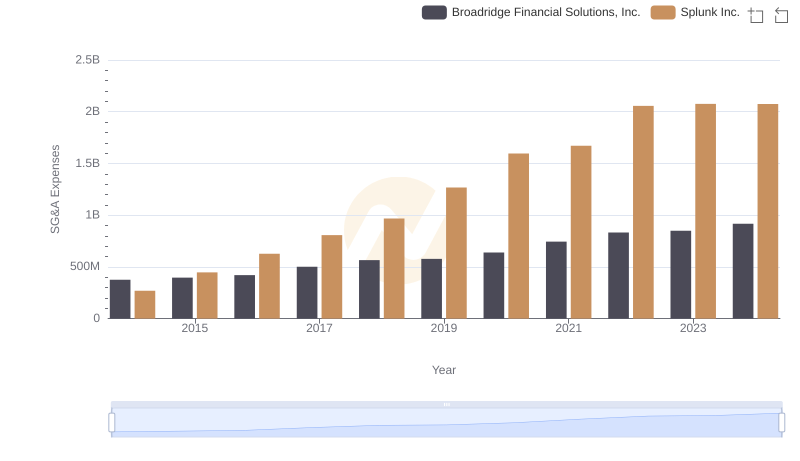
Selling, General, and Administrative Costs: Broadridge Financial Solutions, Inc. vs Splunk Inc.