| __timestamp | Broadridge Financial Solutions, Inc. | Splunk Inc. |
|---|---|---|
| Wednesday, January 1, 2014 | 1761400000 | 35825000 |
| Thursday, January 1, 2015 | 1828200000 | 68378000 |
| Friday, January 1, 2016 | 1975900000 | 114122000 |
| Sunday, January 1, 2017 | 3109600000 | 191053000 |
| Monday, January 1, 2018 | 3169600000 | 256409000 |
| Tuesday, January 1, 2019 | 3131900000 | 344676000 |
| Wednesday, January 1, 2020 | 3265100000 | 429788000 |
| Friday, January 1, 2021 | 3570800000 | 547345000 |
| Saturday, January 1, 2022 | 4116900000 | 733969000 |
| Sunday, January 1, 2023 | 4275500000 | 815995000 |
| Monday, January 1, 2024 | 4572900000 | 865507000 |
Cracking the code
In the ever-evolving landscape of financial technology, Broadridge Financial Solutions, Inc. and Splunk Inc. have carved distinct paths. Over the past decade, Broadridge has consistently outpaced Splunk in terms of cost of revenue, reflecting its expansive operations and market reach. From 2014 to 2024, Broadridge's cost of revenue surged by approximately 160%, peaking at an estimated $4.57 billion in 2024. In contrast, Splunk's cost of revenue, while growing significantly, remains a fraction of Broadridge's, increasing by over 230% to reach around $865 million in the same period.
This stark contrast highlights Broadridge's established dominance in the financial services sector, while Splunk's growth trajectory underscores its rising influence in data analytics. As both companies continue to innovate, their financial strategies will be pivotal in shaping their future market positions.
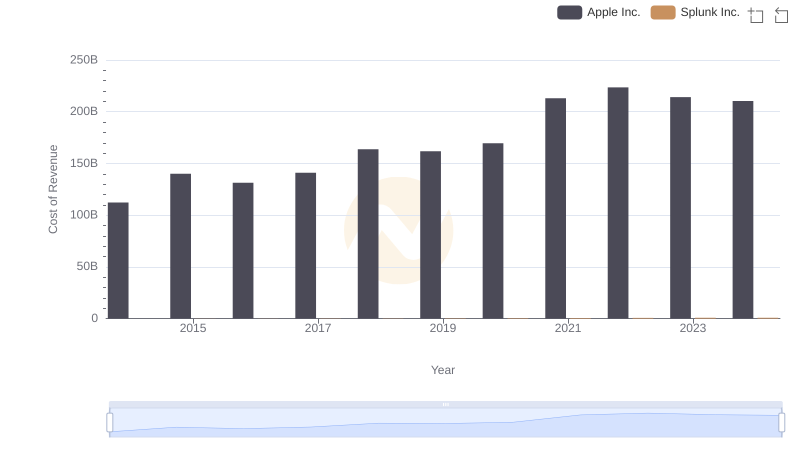
Cost Insights: Breaking Down Apple Inc. and Splunk Inc.'s Expenses
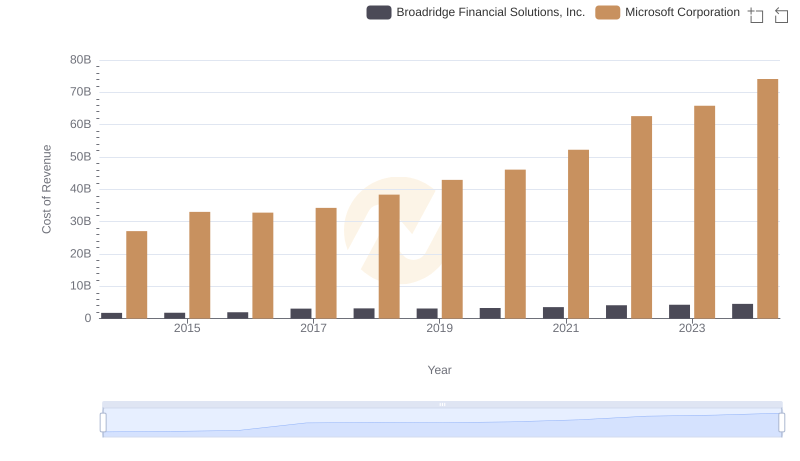
Cost Insights: Breaking Down Microsoft Corporation and Broadridge Financial Solutions, Inc.'s Expenses
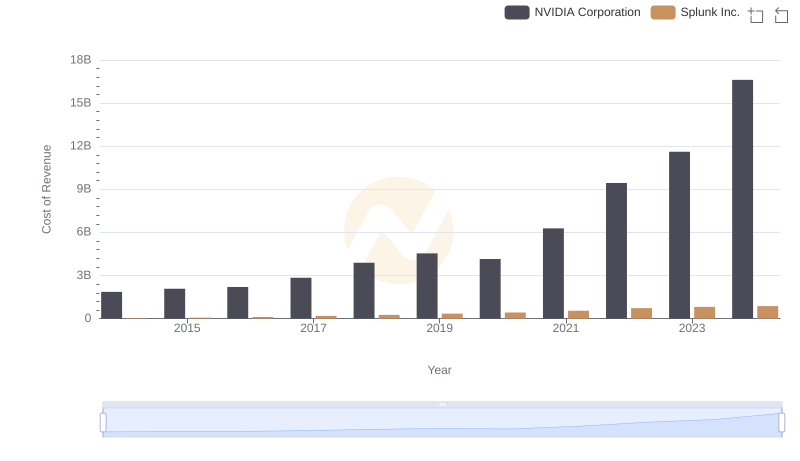
Comparing Cost of Revenue Efficiency: NVIDIA Corporation vs Splunk Inc.
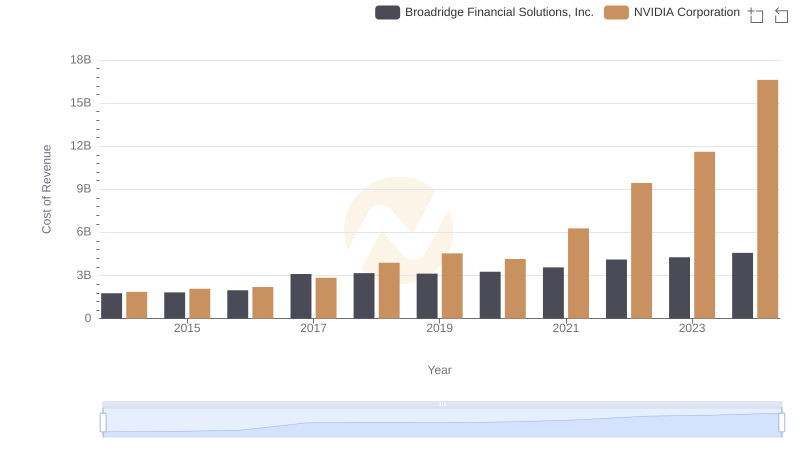
Comparing Cost of Revenue Efficiency: NVIDIA Corporation vs Broadridge Financial Solutions, Inc.
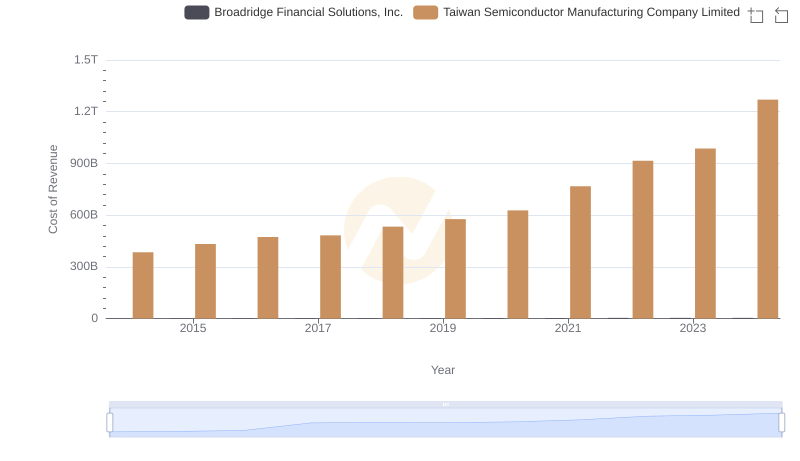
Cost Insights: Breaking Down Taiwan Semiconductor Manufacturing Company Limited and Broadridge Financial Solutions, Inc.'s Expenses
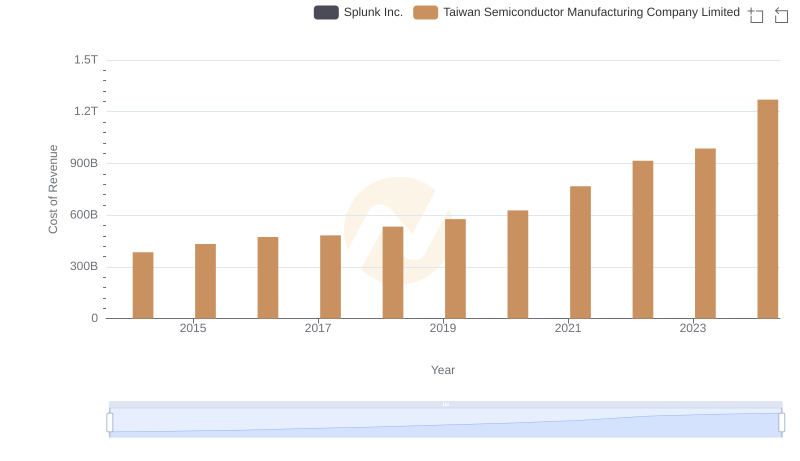
Cost of Revenue: Key Insights for Taiwan Semiconductor Manufacturing Company Limited and Splunk Inc.
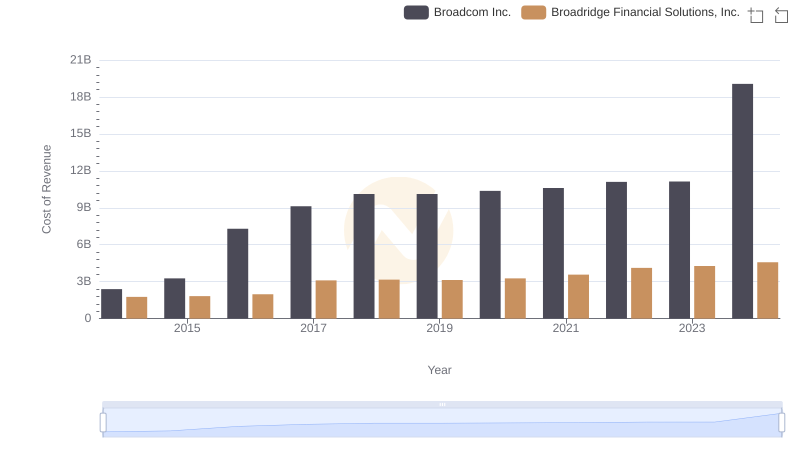
Cost Insights: Breaking Down Broadcom Inc. and Broadridge Financial Solutions, Inc.'s Expenses
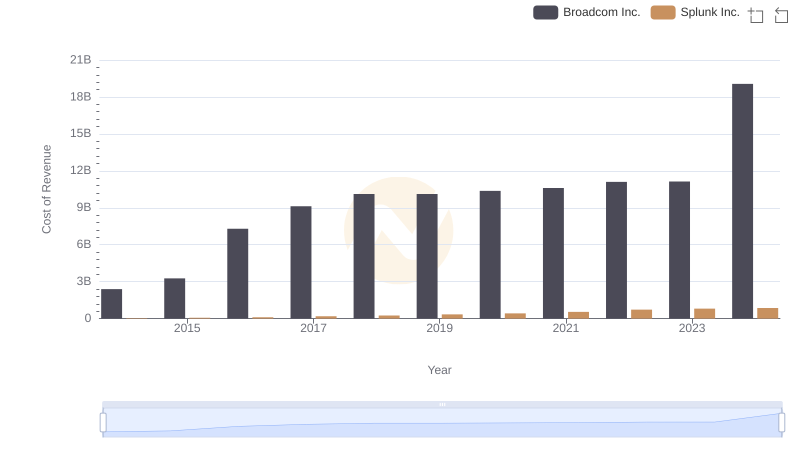
Cost of Revenue Trends: Broadcom Inc. vs Splunk Inc.
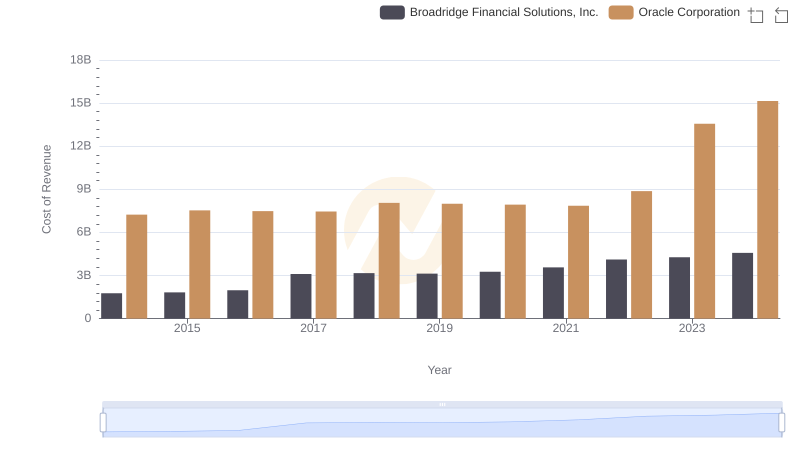
Cost Insights: Breaking Down Oracle Corporation and Broadridge Financial Solutions, Inc.'s Expenses
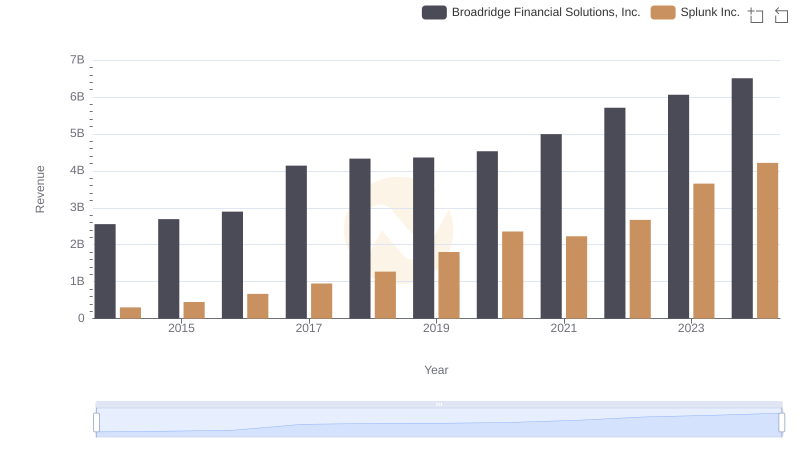
Broadridge Financial Solutions, Inc. or Splunk Inc.: Who Leads in Yearly Revenue?
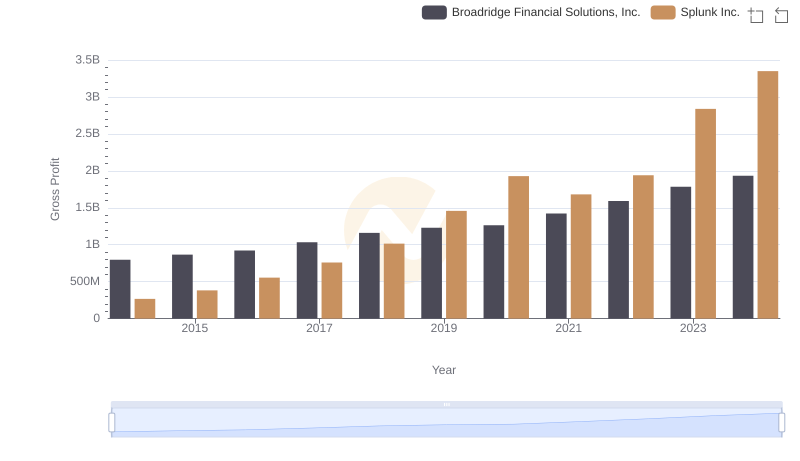
Key Insights on Gross Profit: Broadridge Financial Solutions, Inc. vs Splunk Inc.
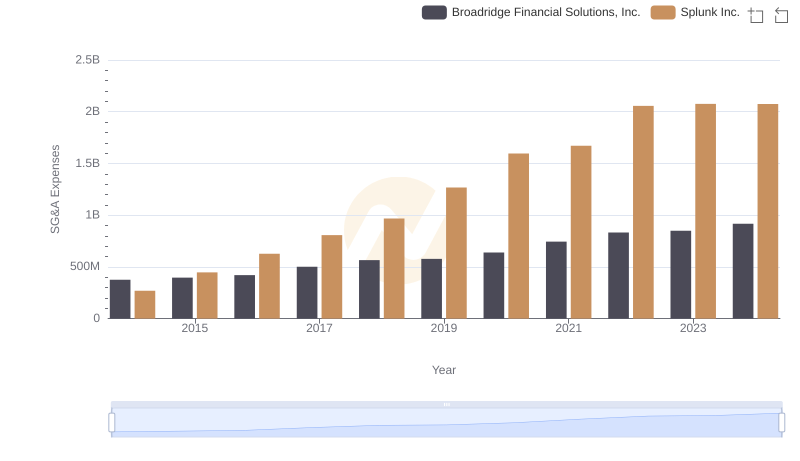
Selling, General, and Administrative Costs: Broadridge Financial Solutions, Inc. vs Splunk Inc.