| __timestamp | Ryanair Holdings plc | Textron Inc. |
|---|---|---|
| Wednesday, January 1, 2014 | 5036700000 | 13878000000 |
| Thursday, January 1, 2015 | 5654000000 | 13423000000 |
| Friday, January 1, 2016 | 6535800000 | 13788000000 |
| Sunday, January 1, 2017 | 6647800000 | 14198000000 |
| Monday, January 1, 2018 | 7151000000 | 13972000000 |
| Tuesday, January 1, 2019 | 7697400000 | 13630000000 |
| Wednesday, January 1, 2020 | 8494799999 | 11651000000 |
| Friday, January 1, 2021 | 1635800000 | 12382000000 |
| Saturday, January 1, 2022 | 4800900000 | 12869000000 |
| Sunday, January 1, 2023 | 10775200000 | 13683000000 |
| Monday, January 1, 2024 | 13443800000 | 13702000000 |
In pursuit of knowledge
In the ever-evolving landscape of global business, Ryanair Holdings plc and Textron Inc. stand as titans in their respective industries. Over the past decade, these companies have showcased remarkable resilience and adaptability. From 2014 to 2024, Ryanair's revenue trajectory has been a rollercoaster, with a significant dip in 2021, plummeting to just 24% of its 2020 revenue. However, by 2024, Ryanair has rebounded impressively, achieving a revenue surge of over 700% from its 2021 low. Meanwhile, Textron Inc. has maintained a more stable revenue stream, with fluctuations of less than 10% annually, demonstrating its robust market position. This comparative analysis not only highlights the dynamic nature of the airline and manufacturing sectors but also underscores the strategic maneuvers these companies have employed to navigate economic challenges and capitalize on growth opportunities.
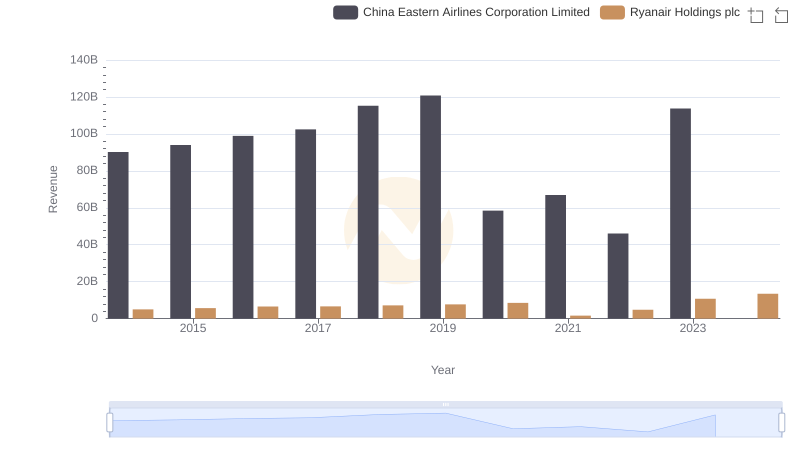
Ryanair Holdings plc vs China Eastern Airlines Corporation Limited: Examining Key Revenue Metrics
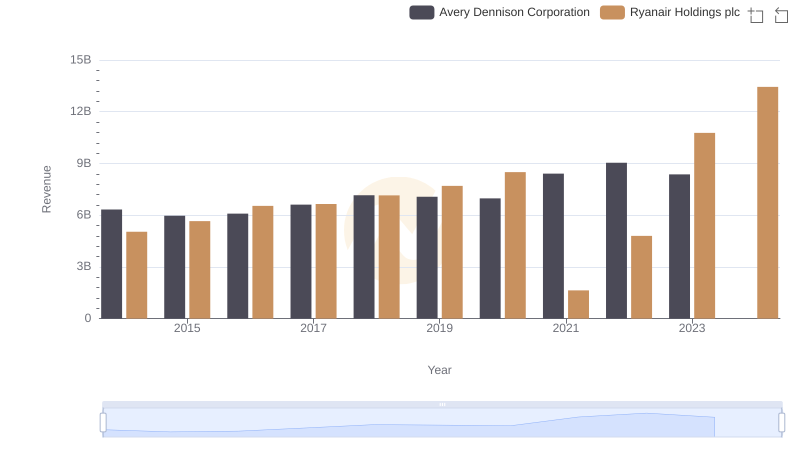
Breaking Down Revenue Trends: Ryanair Holdings plc vs Avery Dennison Corporation
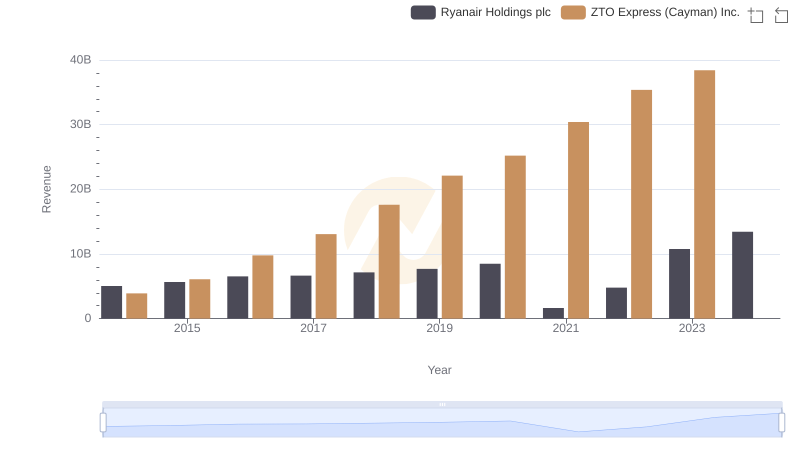
Who Generates More Revenue? Ryanair Holdings plc or ZTO Express (Cayman) Inc.
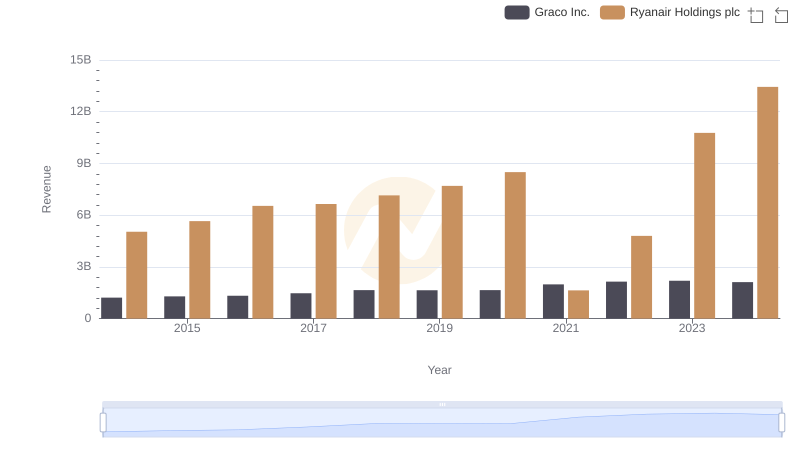
Ryanair Holdings plc and Graco Inc.: A Comprehensive Revenue Analysis
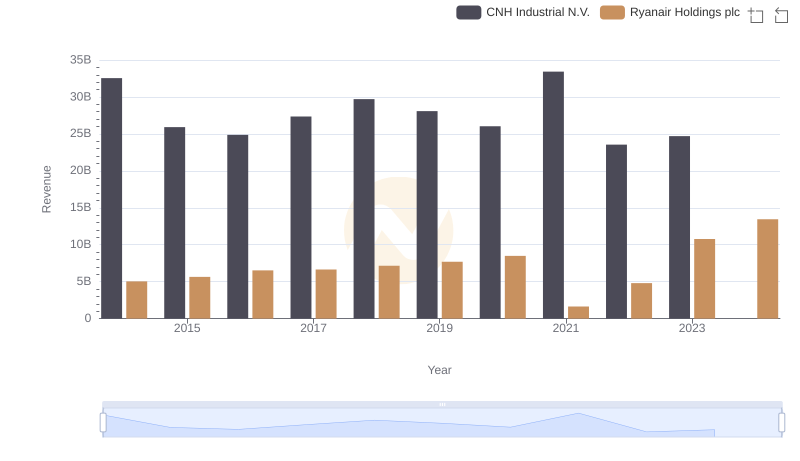
Breaking Down Revenue Trends: Ryanair Holdings plc vs CNH Industrial N.V.
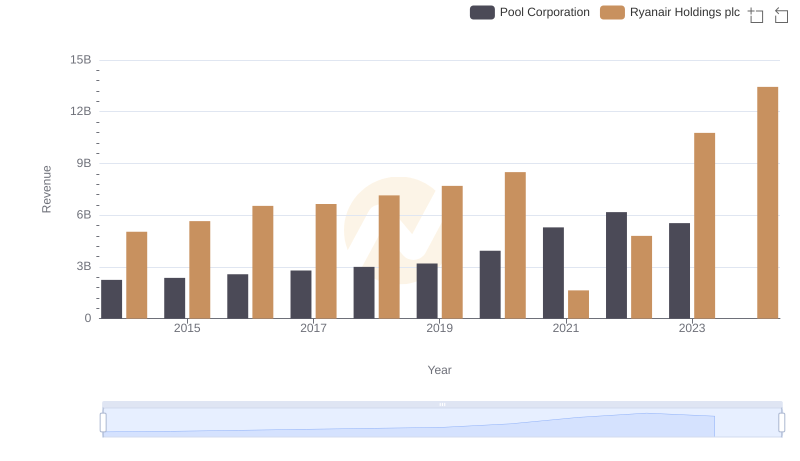
Breaking Down Revenue Trends: Ryanair Holdings plc vs Pool Corporation

Ryanair Holdings plc or Stanley Black & Decker, Inc.: Who Leads in Yearly Revenue?
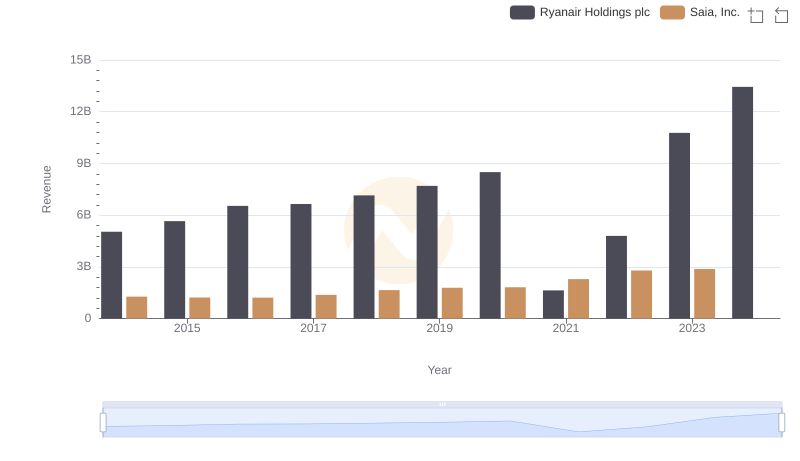
Comparing Revenue Performance: Ryanair Holdings plc or Saia, Inc.?
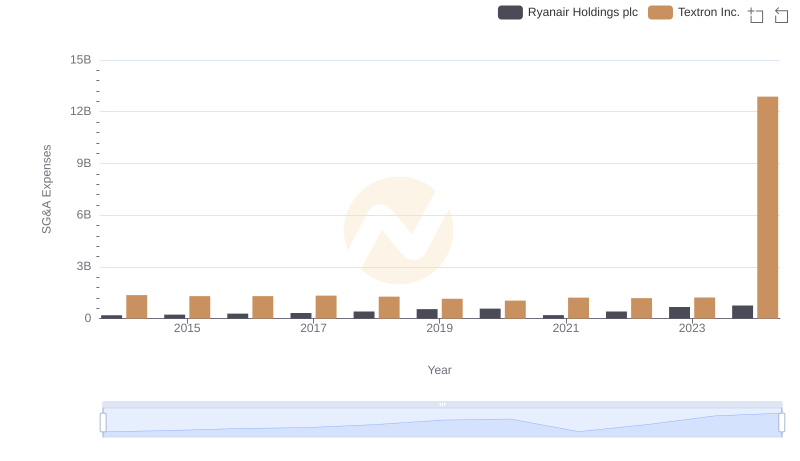
Who Optimizes SG&A Costs Better? Ryanair Holdings plc or Textron Inc.