| __timestamp | Pool Corporation | Ryanair Holdings plc |
|---|---|---|
| Wednesday, January 1, 2014 | 2246562000 | 5036700000 |
| Thursday, January 1, 2015 | 2363139000 | 5654000000 |
| Friday, January 1, 2016 | 2570803000 | 6535800000 |
| Sunday, January 1, 2017 | 2788188000 | 6647800000 |
| Monday, January 1, 2018 | 2998097000 | 7151000000 |
| Tuesday, January 1, 2019 | 3199517000 | 7697400000 |
| Wednesday, January 1, 2020 | 3936623000 | 8494799999 |
| Friday, January 1, 2021 | 5295584000 | 1635800000 |
| Saturday, January 1, 2022 | 6179727000 | 4800900000 |
| Sunday, January 1, 2023 | 5541595000 | 10775200000 |
| Monday, January 1, 2024 | 13443800000 |
Unlocking the unknown
In the ever-evolving landscape of global business, understanding revenue trends is crucial for investors and stakeholders. This analysis delves into the revenue trajectories of Ryanair Holdings plc and Pool Corporation from 2014 to 2023. Over this period, Ryanair's revenue exhibited a robust growth of approximately 167%, peaking in 2023 with a remarkable 107% increase from the previous year. In contrast, Pool Corporation's revenue grew steadily by about 147%, reaching its zenith in 2022. Notably, 2021 marked a challenging year for Ryanair, with revenues plummeting by nearly 81% due to the pandemic's impact, while Pool Corporation saw a 35% surge, highlighting its resilience. The data for 2024 is incomplete, but the trends suggest a promising outlook for both companies. This comparative analysis underscores the dynamic nature of the airline and pool supply industries, offering valuable insights for future strategic planning.
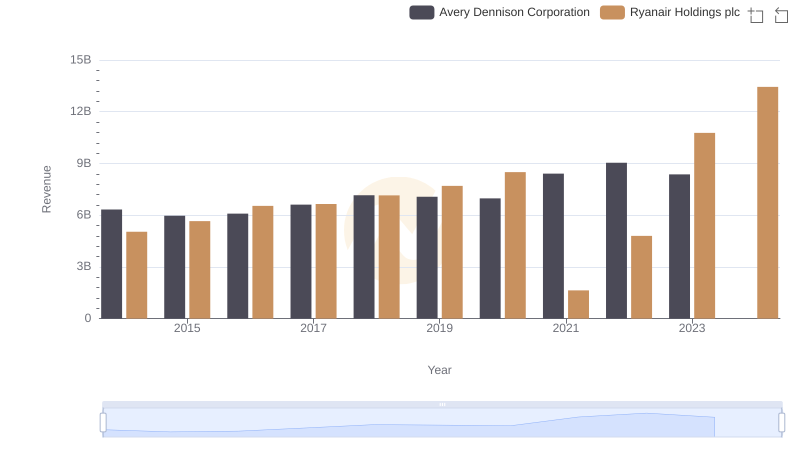
Breaking Down Revenue Trends: Ryanair Holdings plc vs Avery Dennison Corporation
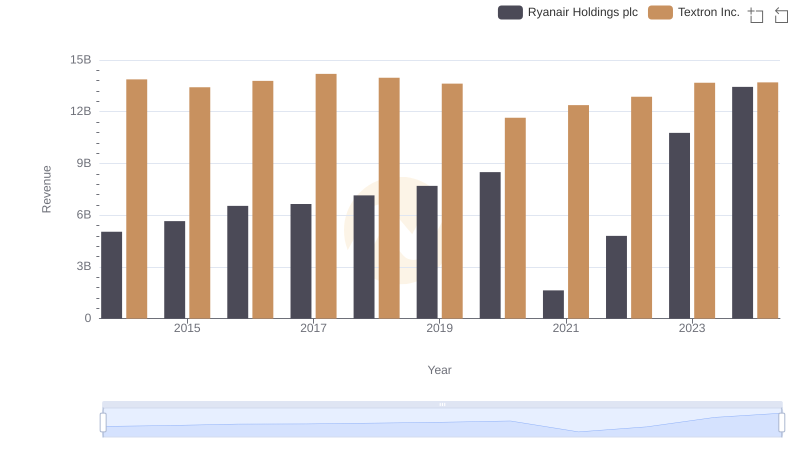
Ryanair Holdings plc and Textron Inc.: A Comprehensive Revenue Analysis
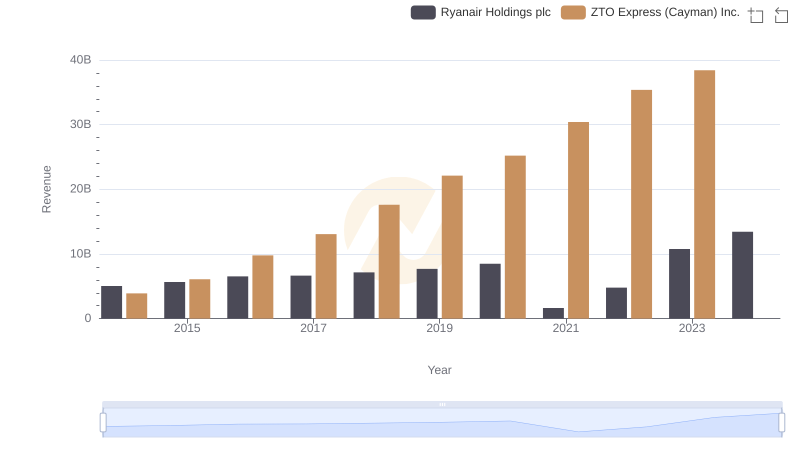
Who Generates More Revenue? Ryanair Holdings plc or ZTO Express (Cayman) Inc.
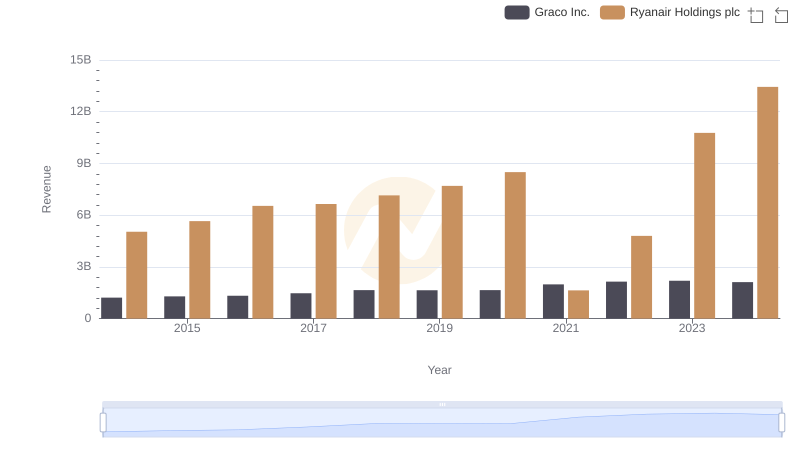
Ryanair Holdings plc and Graco Inc.: A Comprehensive Revenue Analysis
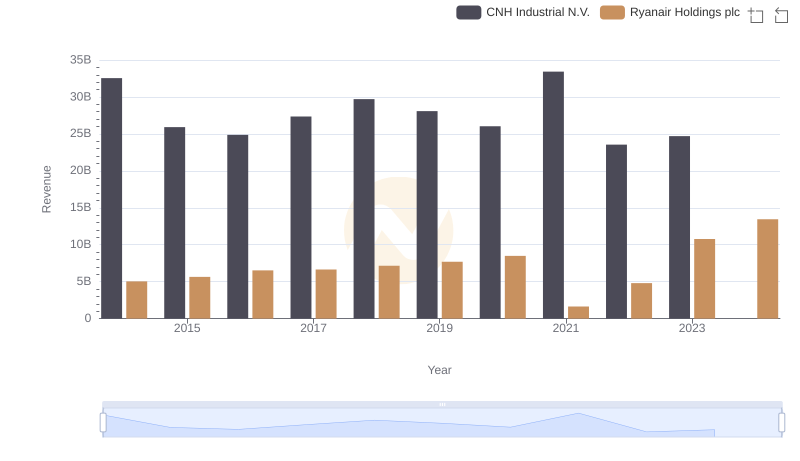
Breaking Down Revenue Trends: Ryanair Holdings plc vs CNH Industrial N.V.

Ryanair Holdings plc or Stanley Black & Decker, Inc.: Who Leads in Yearly Revenue?
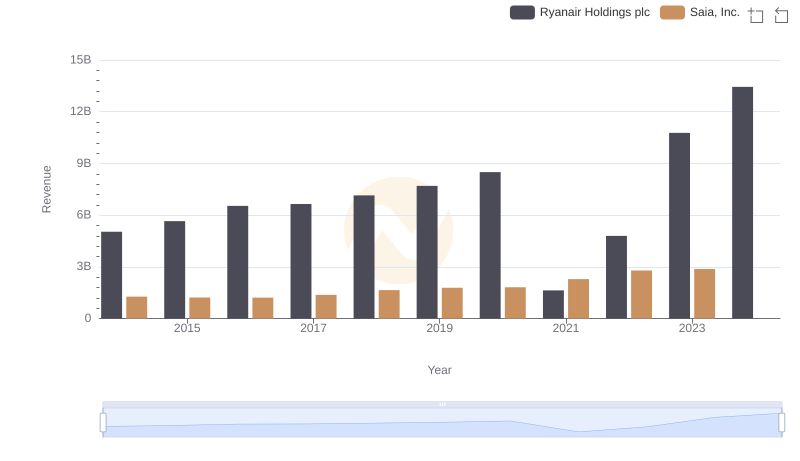
Comparing Revenue Performance: Ryanair Holdings plc or Saia, Inc.?
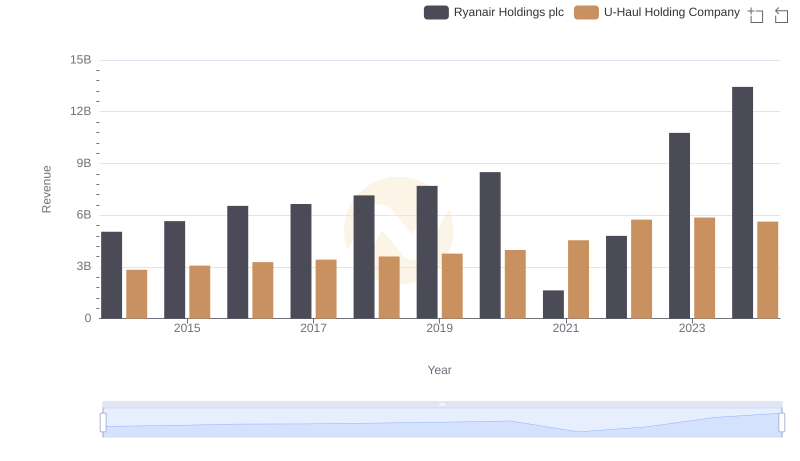
Breaking Down Revenue Trends: Ryanair Holdings plc vs U-Haul Holding Company
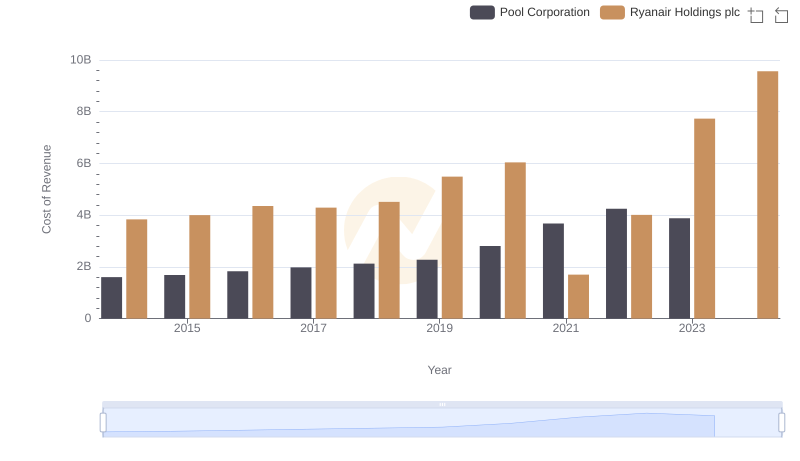
Cost Insights: Breaking Down Ryanair Holdings plc and Pool Corporation's Expenses
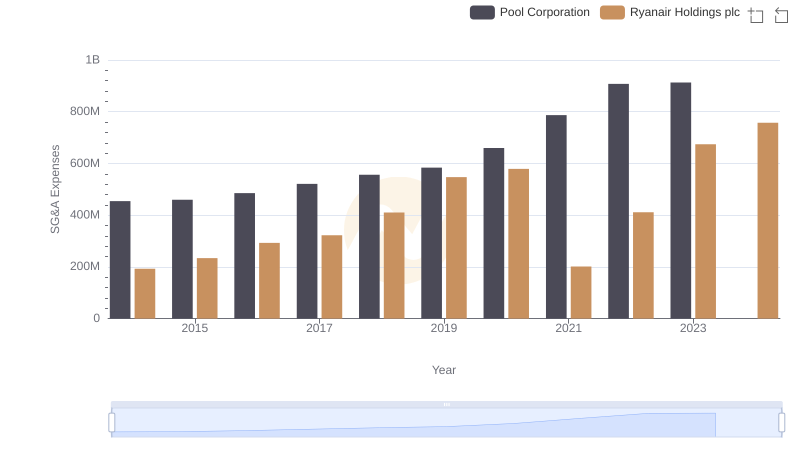
Breaking Down SG&A Expenses: Ryanair Holdings plc vs Pool Corporation