| __timestamp | Comfort Systems USA, Inc. | Waste Management, Inc. |
|---|---|---|
| Wednesday, January 1, 2014 | 1161024000 | 9002000000 |
| Thursday, January 1, 2015 | 1262390000 | 8231000000 |
| Friday, January 1, 2016 | 1290331000 | 8486000000 |
| Sunday, January 1, 2017 | 1421641000 | 9021000000 |
| Monday, January 1, 2018 | 1736600000 | 9249000000 |
| Tuesday, January 1, 2019 | 2113334000 | 9496000000 |
| Wednesday, January 1, 2020 | 2309676000 | 9341000000 |
| Friday, January 1, 2021 | 2510429000 | 11111000000 |
| Saturday, January 1, 2022 | 3398756000 | 12294000000 |
| Sunday, January 1, 2023 | 4216251000 | 12606000000 |
| Monday, January 1, 2024 | 13383000000 |
In pursuit of knowledge
In the ever-evolving landscape of American industry, Waste Management, Inc. and Comfort Systems USA, Inc. stand as titans in their respective fields. Over the past decade, from 2014 to 2023, these companies have showcased remarkable growth in their cost of revenue, a key indicator of operational scale and efficiency.
Waste Management, Inc., a leader in waste services, has consistently maintained a cost of revenue that is approximately 4 times higher than Comfort Systems USA, Inc., a prominent player in the mechanical services sector. Notably, Waste Management's cost of revenue surged by nearly 40% from 2014 to 2023, reflecting its expanding operations and market dominance. Meanwhile, Comfort Systems USA, Inc. experienced a staggering 263% increase, highlighting its rapid growth trajectory.
This comparison not only underscores the diverse nature of these industries but also offers insights into their strategic priorities and market dynamics.
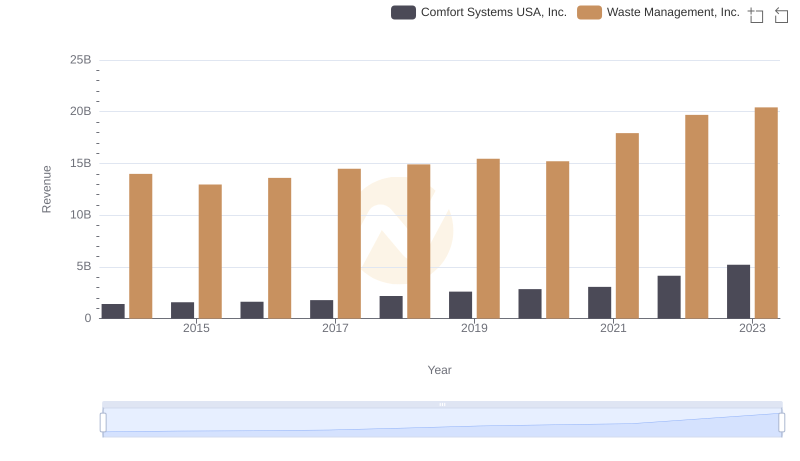
Revenue Insights: Waste Management, Inc. and Comfort Systems USA, Inc. Performance Compared
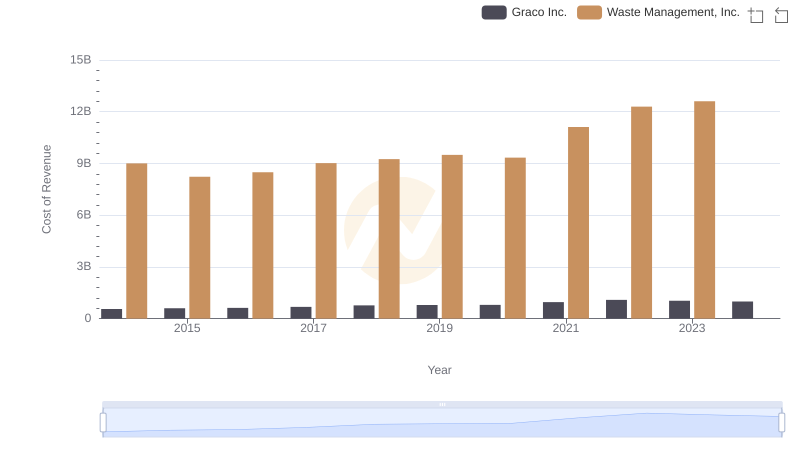
Cost Insights: Breaking Down Waste Management, Inc. and Graco Inc.'s Expenses
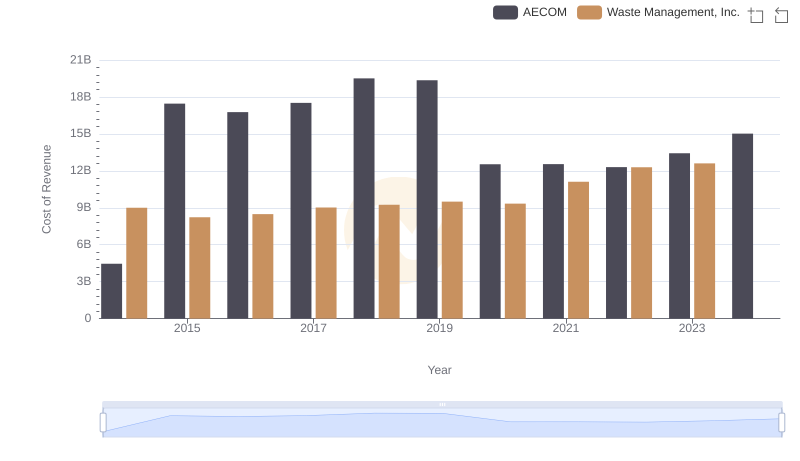
Cost of Revenue Comparison: Waste Management, Inc. vs AECOM
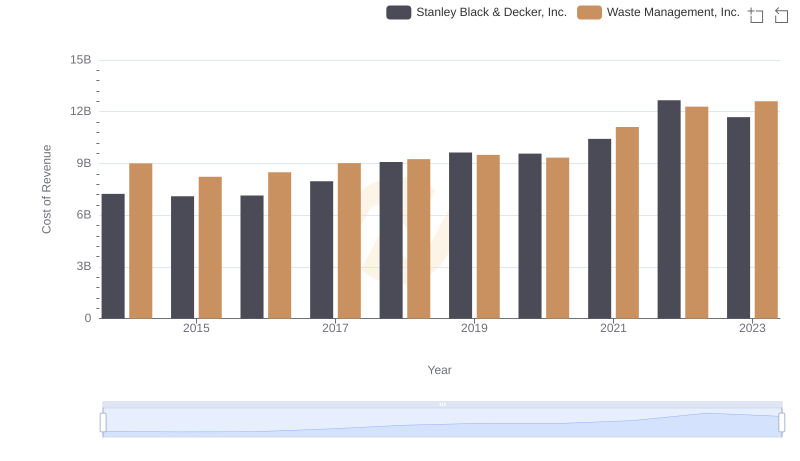
Cost of Revenue: Key Insights for Waste Management, Inc. and Stanley Black & Decker, Inc.
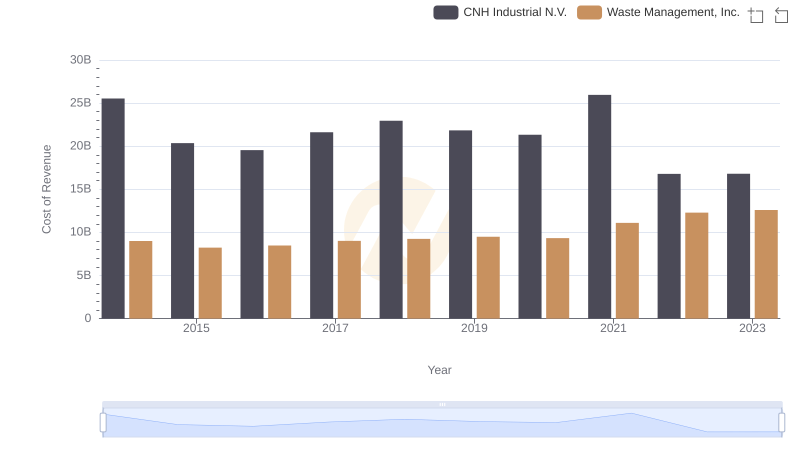
Waste Management, Inc. vs CNH Industrial N.V.: Efficiency in Cost of Revenue Explored
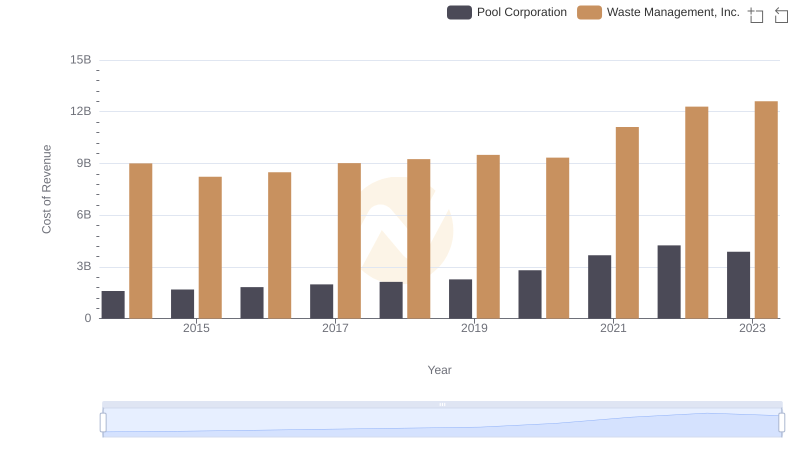
Cost Insights: Breaking Down Waste Management, Inc. and Pool Corporation's Expenses
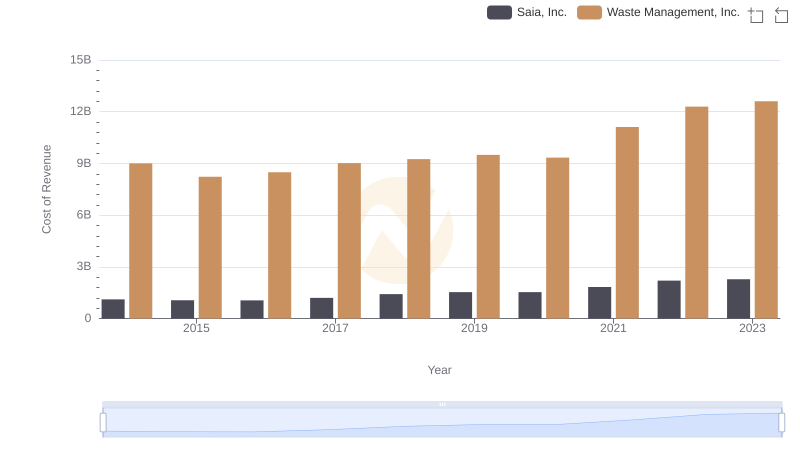
Cost Insights: Breaking Down Waste Management, Inc. and Saia, Inc.'s Expenses
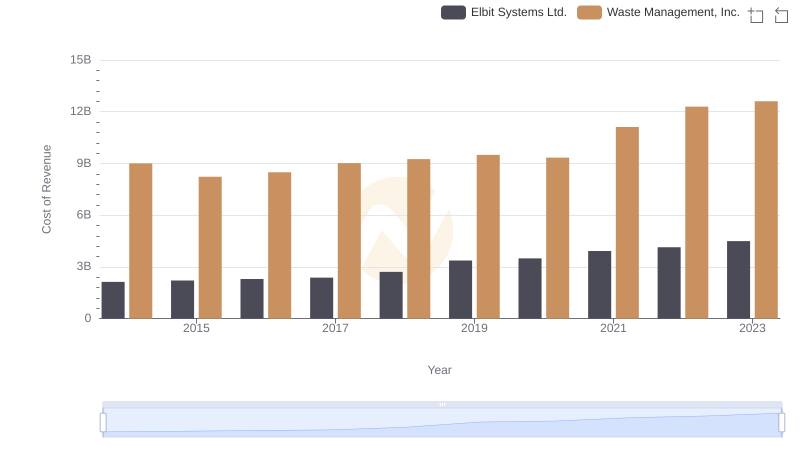
Comparing Cost of Revenue Efficiency: Waste Management, Inc. vs Elbit Systems Ltd.
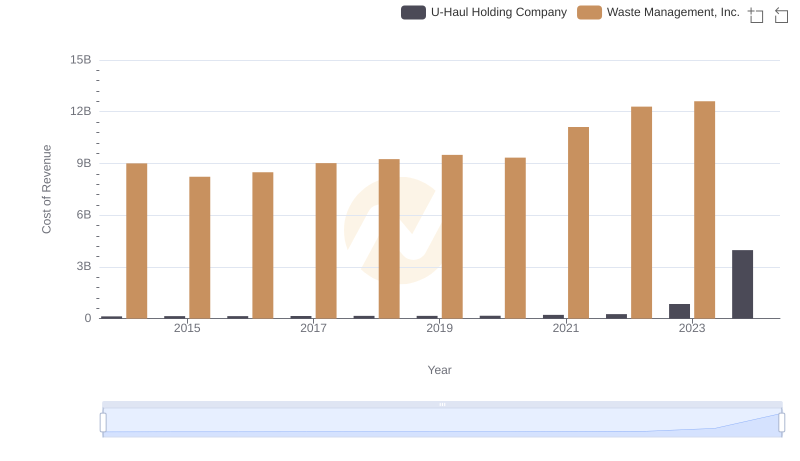
Cost Insights: Breaking Down Waste Management, Inc. and U-Haul Holding Company's Expenses
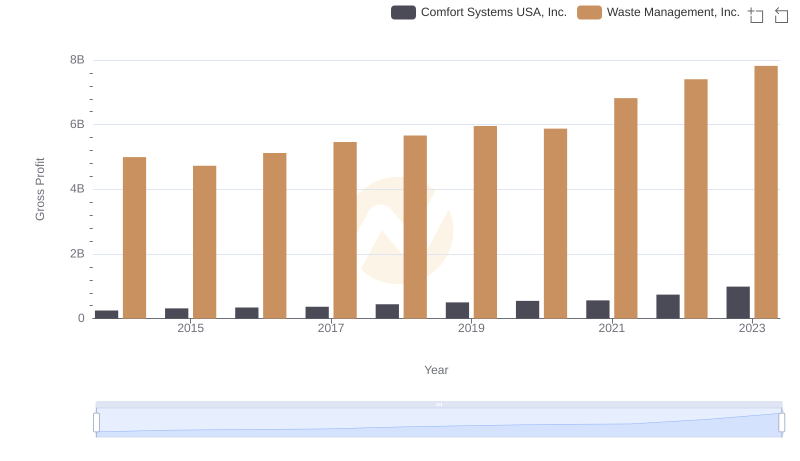
Who Generates Higher Gross Profit? Waste Management, Inc. or Comfort Systems USA, Inc.
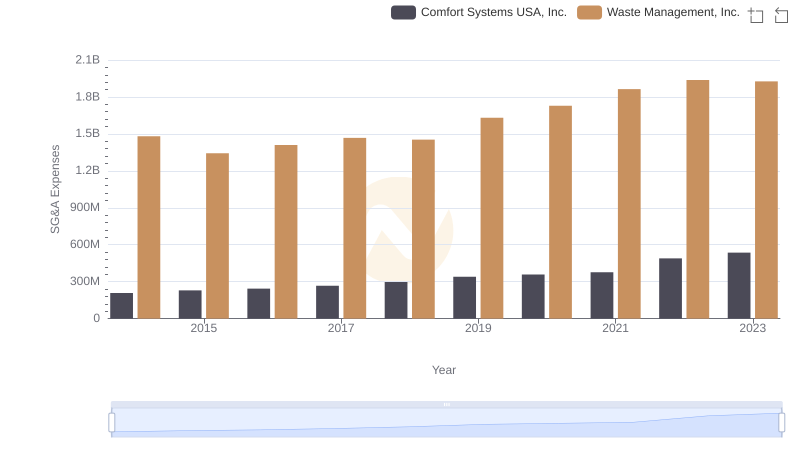
Waste Management, Inc. vs Comfort Systems USA, Inc.: SG&A Expense Trends