| __timestamp | Expeditors International of Washington, Inc. | Ryanair Holdings plc |
|---|---|---|
| Wednesday, January 1, 2014 | 6564721000 | 5036700000 |
| Thursday, January 1, 2015 | 6616632000 | 5654000000 |
| Friday, January 1, 2016 | 6098037000 | 6535800000 |
| Sunday, January 1, 2017 | 6920948000 | 6647800000 |
| Monday, January 1, 2018 | 8138365000 | 7151000000 |
| Tuesday, January 1, 2019 | 8175426000 | 7697400000 |
| Wednesday, January 1, 2020 | 10116481000 | 8494799999 |
| Friday, January 1, 2021 | 16523517000 | 1635800000 |
| Saturday, January 1, 2022 | 17071284000 | 4800900000 |
| Sunday, January 1, 2023 | 9300110000 | 10775200000 |
| Monday, January 1, 2024 | 10600515000 | 13443800000 |
Igniting the spark of knowledge
In the ever-evolving landscape of global business, understanding revenue trends is crucial. This analysis compares the annual revenue performance of Ryanair Holdings plc and Expeditors International of Washington, Inc. from 2014 to 2023. Over this period, Expeditors International saw a remarkable growth, with revenue peaking in 2022 at approximately 170% of its 2014 value. Meanwhile, Ryanair's revenue journey was more volatile, with a significant dip in 2021, likely due to the pandemic's impact on the airline industry. However, Ryanair rebounded strongly, achieving a 113% increase in revenue by 2023 compared to 2014. Notably, 2024 data for Expeditors is missing, highlighting the importance of complete datasets for accurate analysis. This comparison underscores the resilience and adaptability of these companies in the face of global challenges.
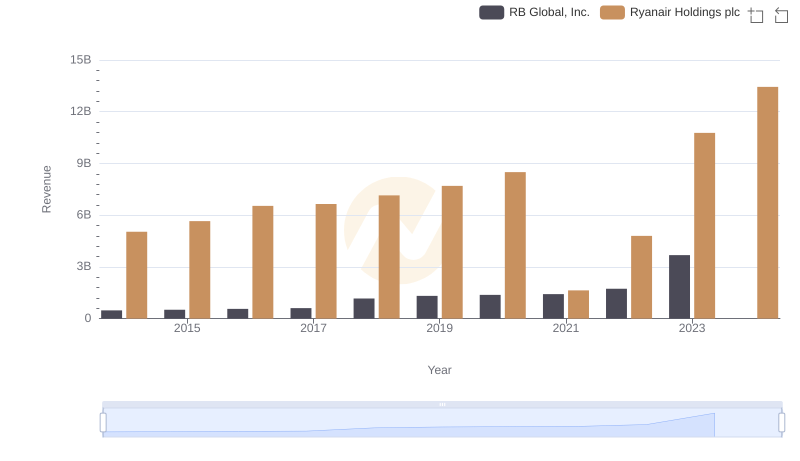
Comparing Revenue Performance: Ryanair Holdings plc or RB Global, Inc.?
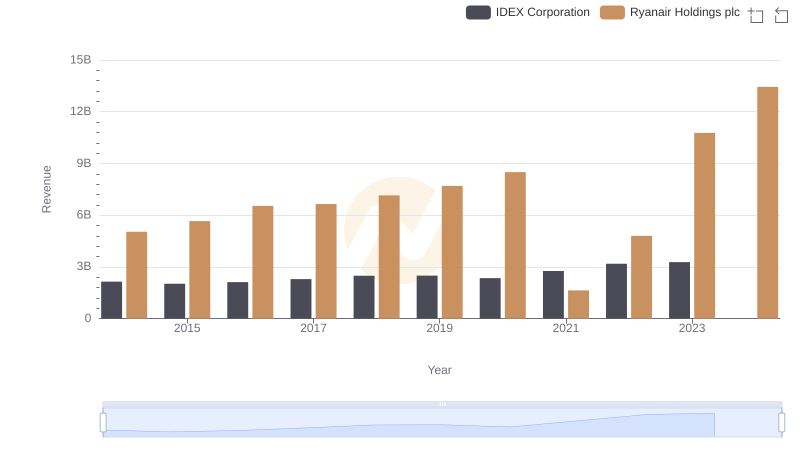
Annual Revenue Comparison: Ryanair Holdings plc vs IDEX Corporation
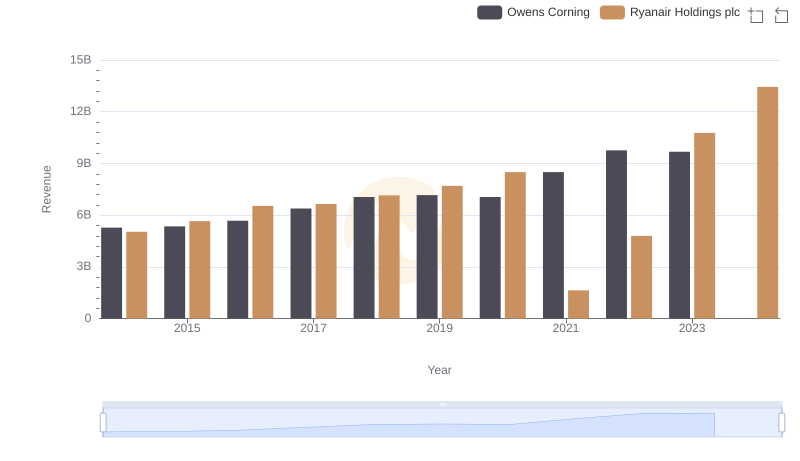
Revenue Showdown: Ryanair Holdings plc vs Owens Corning
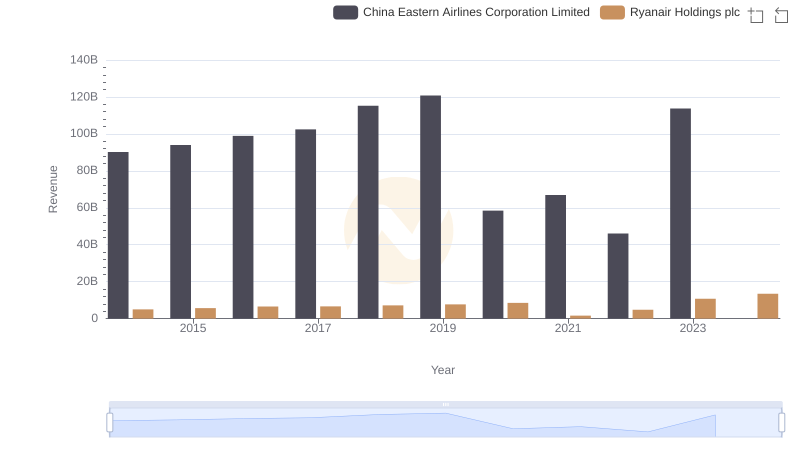
Ryanair Holdings plc vs China Eastern Airlines Corporation Limited: Examining Key Revenue Metrics
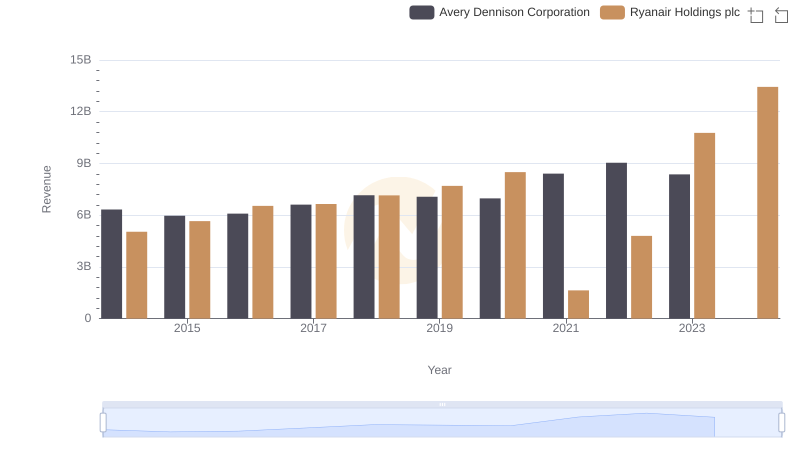
Breaking Down Revenue Trends: Ryanair Holdings plc vs Avery Dennison Corporation
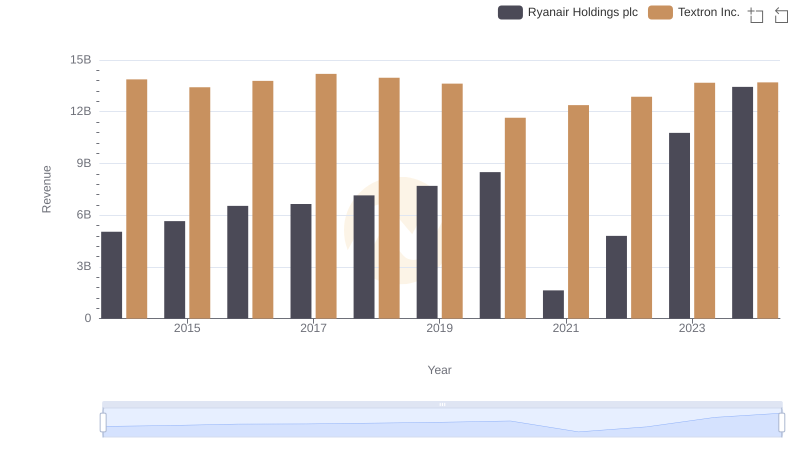
Ryanair Holdings plc and Textron Inc.: A Comprehensive Revenue Analysis
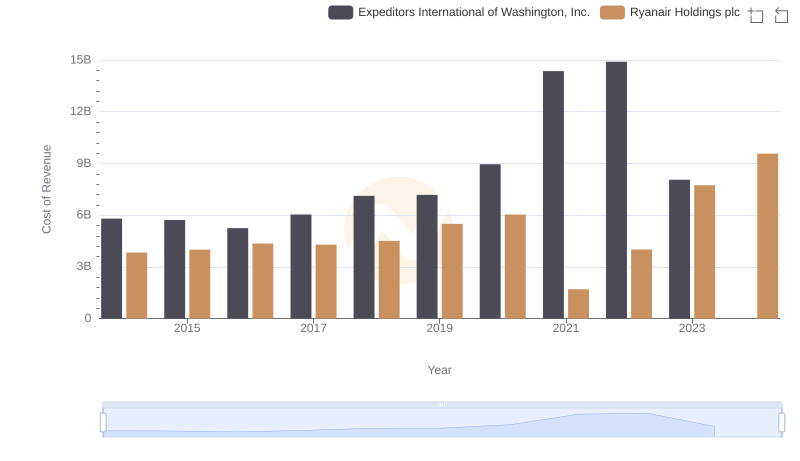
Cost Insights: Breaking Down Ryanair Holdings plc and Expeditors International of Washington, Inc.'s Expenses
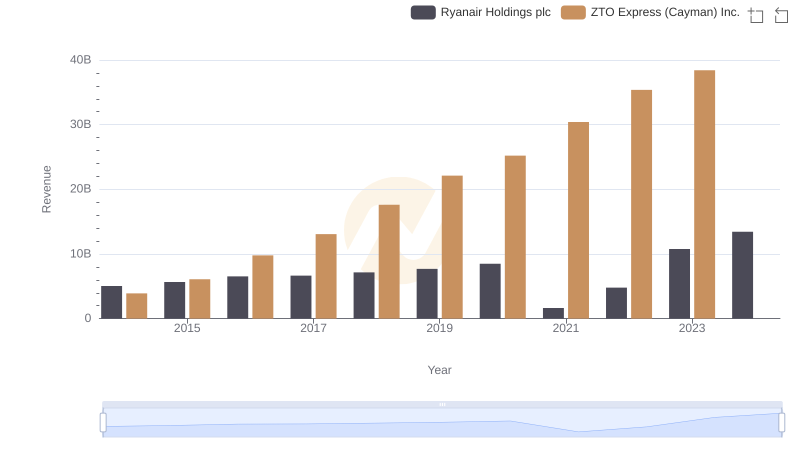
Who Generates More Revenue? Ryanair Holdings plc or ZTO Express (Cayman) Inc.
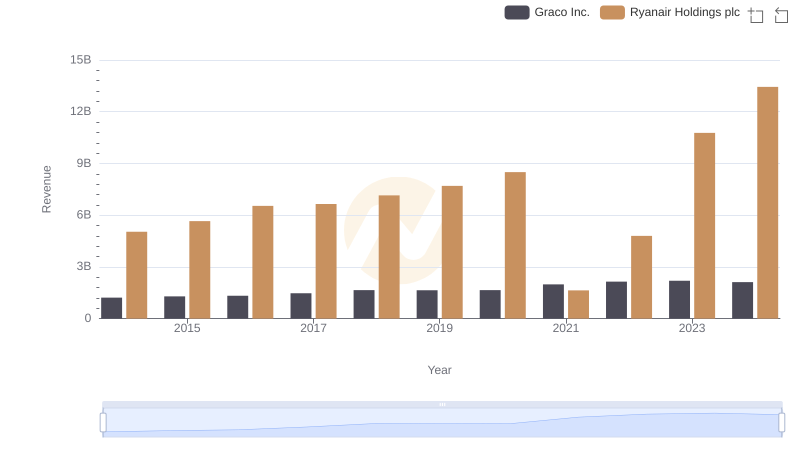
Ryanair Holdings plc and Graco Inc.: A Comprehensive Revenue Analysis
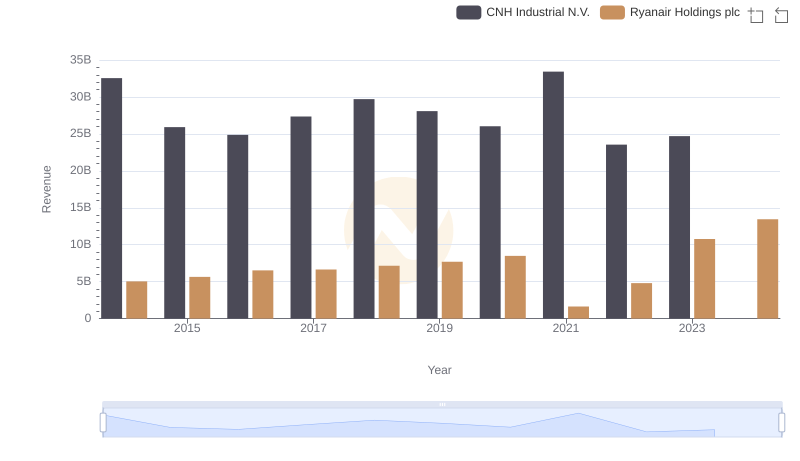
Breaking Down Revenue Trends: Ryanair Holdings plc vs CNH Industrial N.V.
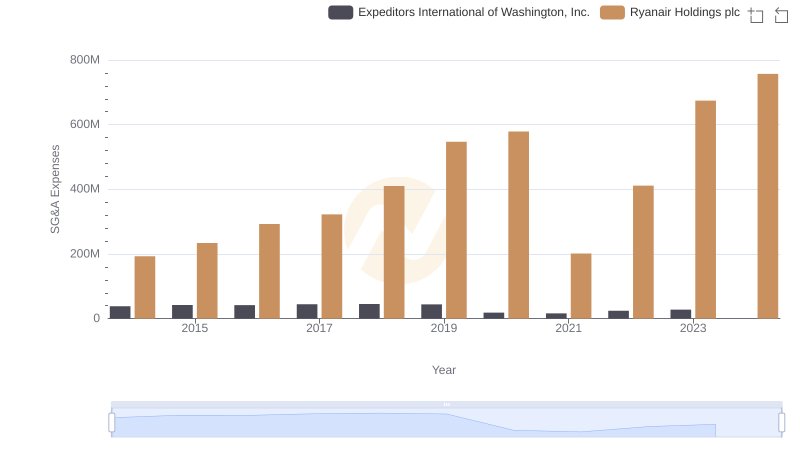
Selling, General, and Administrative Costs: Ryanair Holdings plc vs Expeditors International of Washington, Inc.