| __timestamp | Guidewire Software, Inc. | International Business Machines Corporation |
|---|---|---|
| Wednesday, January 1, 2014 | 76178000 | 5437000000 |
| Thursday, January 1, 2015 | 93440000 | 5247000000 |
| Friday, January 1, 2016 | 112496000 | 5726000000 |
| Sunday, January 1, 2017 | 130323000 | 5590000000 |
| Monday, January 1, 2018 | 171657000 | 5379000000 |
| Tuesday, January 1, 2019 | 188541000 | 5910000000 |
| Wednesday, January 1, 2020 | 200575000 | 6262000000 |
| Friday, January 1, 2021 | 219494000 | 6488000000 |
| Saturday, January 1, 2022 | 249665000 | 6567000000 |
| Sunday, January 1, 2023 | 249746000 | 6775000000 |
| Monday, January 1, 2024 | 269381000 | 0 |
Unlocking the unknown
In the ever-evolving tech landscape, innovation is the lifeblood of success. This chart offers a fascinating glimpse into the research and development (R&D) spending trends of two industry giants: International Business Machines Corporation (IBM) and Guidewire Software, Inc., from 2014 to 2023.
IBM, a stalwart in the tech world, consistently allocated a significant portion of its resources to R&D, peaking at approximately $6.8 billion in 2023. This represents a steady increase of around 25% from 2014. In contrast, Guidewire, a rising star in the software industry, demonstrated a remarkable growth trajectory, with R&D expenses surging by over 250% during the same period.
While IBM's spending dwarfs Guidewire's in absolute terms, the latter's rapid growth underscores its commitment to innovation. This comparison highlights the diverse strategies companies employ to stay competitive in a dynamic market.
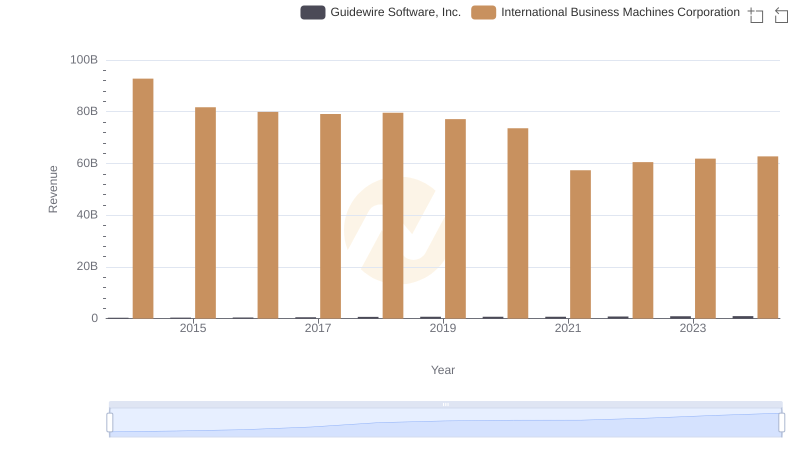
International Business Machines Corporation or Guidewire Software, Inc.: Who Leads in Yearly Revenue?
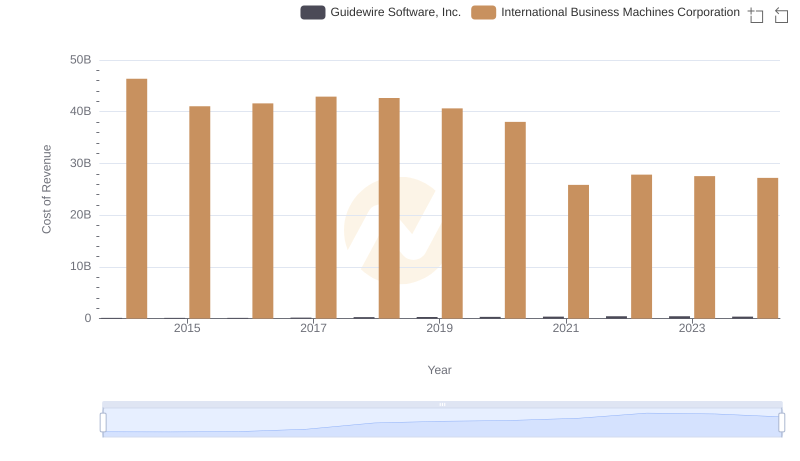
International Business Machines Corporation vs Guidewire Software, Inc.: Efficiency in Cost of Revenue Explored
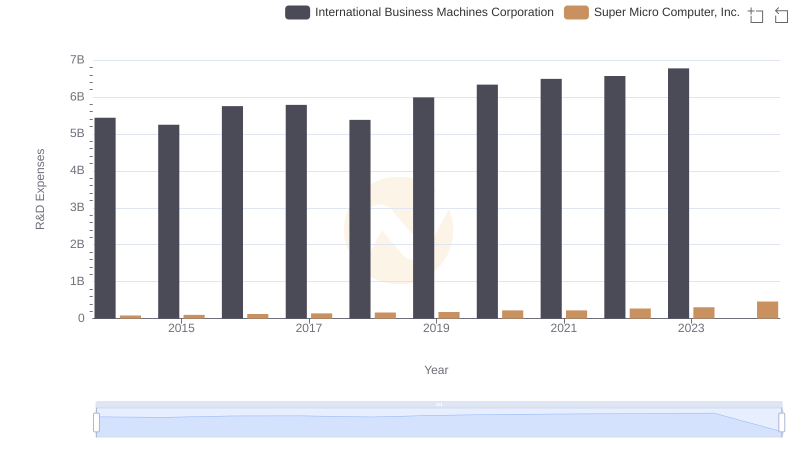
R&D Spending Showdown: International Business Machines Corporation vs Super Micro Computer, Inc.
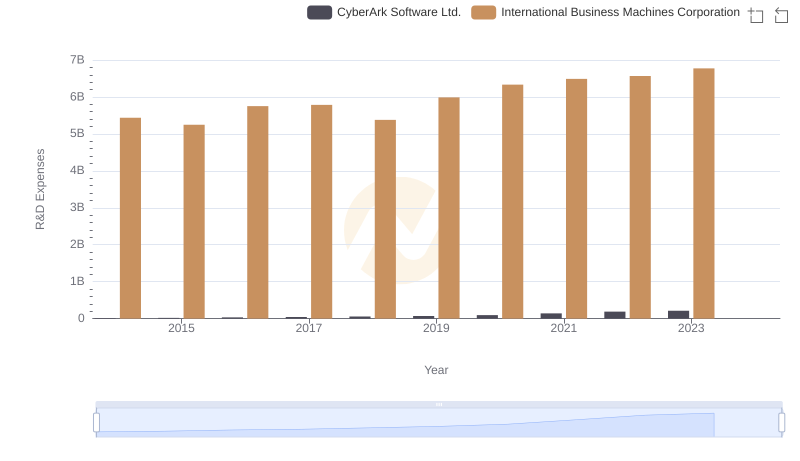
International Business Machines Corporation or CyberArk Software Ltd.: Who Invests More in Innovation?
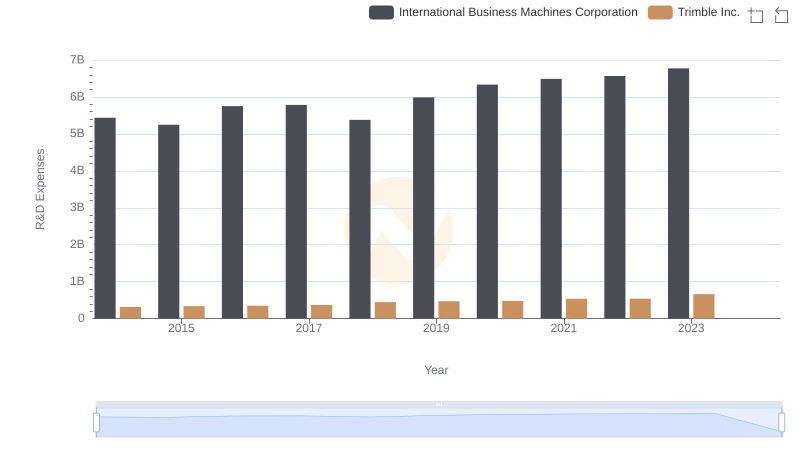
Analyzing R&D Budgets: International Business Machines Corporation vs Trimble Inc.
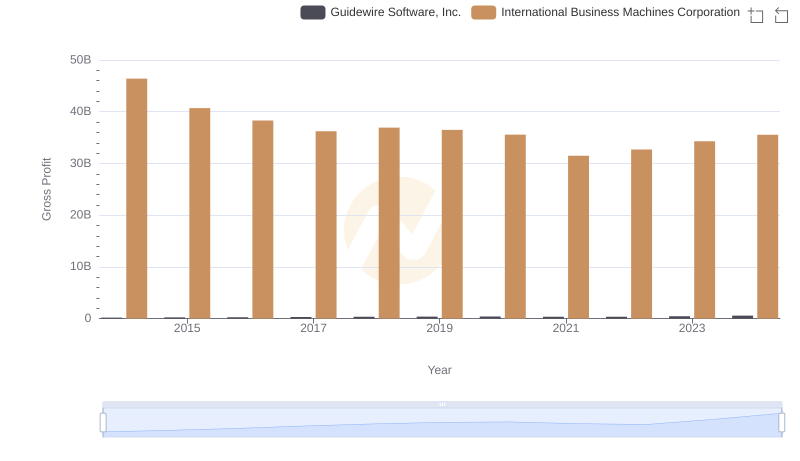
Key Insights on Gross Profit: International Business Machines Corporation vs Guidewire Software, Inc.
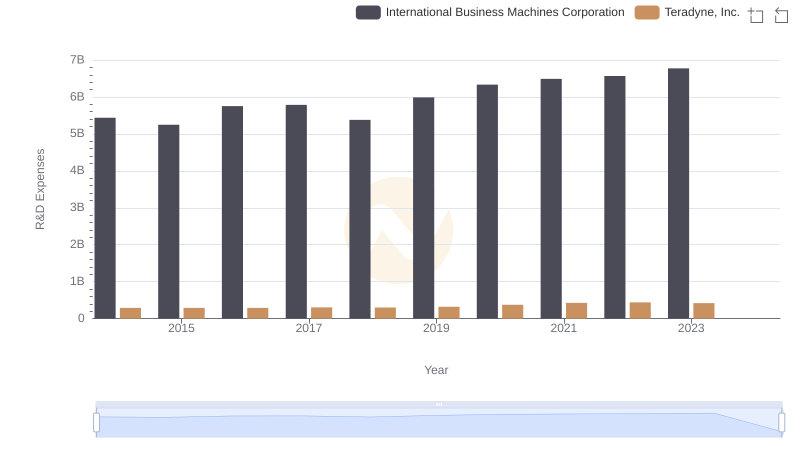
R&D Spending Showdown: International Business Machines Corporation vs Teradyne, Inc.
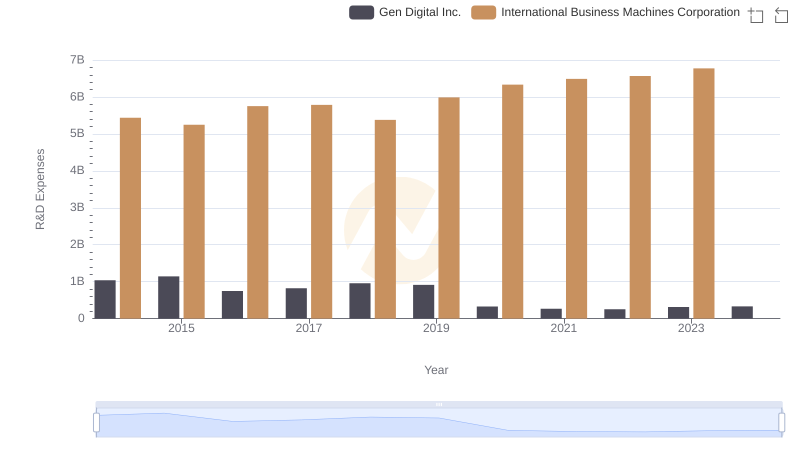
International Business Machines Corporation or Gen Digital Inc.: Who Invests More in Innovation?
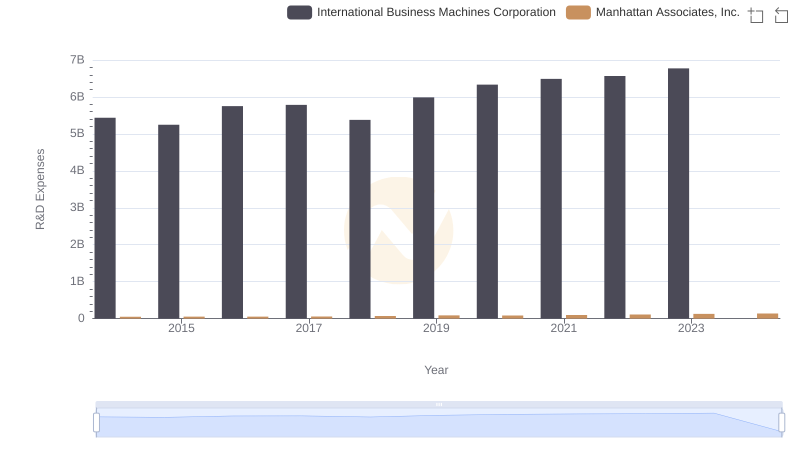
Research and Development: Comparing Key Metrics for International Business Machines Corporation and Manhattan Associates, Inc.
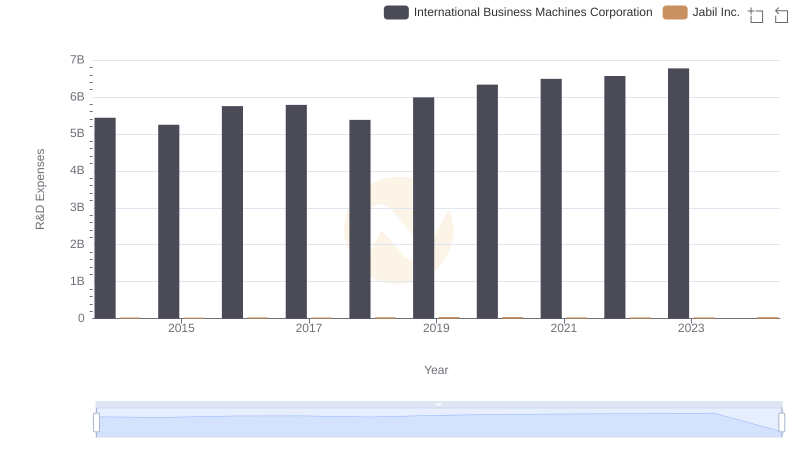
International Business Machines Corporation vs Jabil Inc.: Strategic Focus on R&D Spending
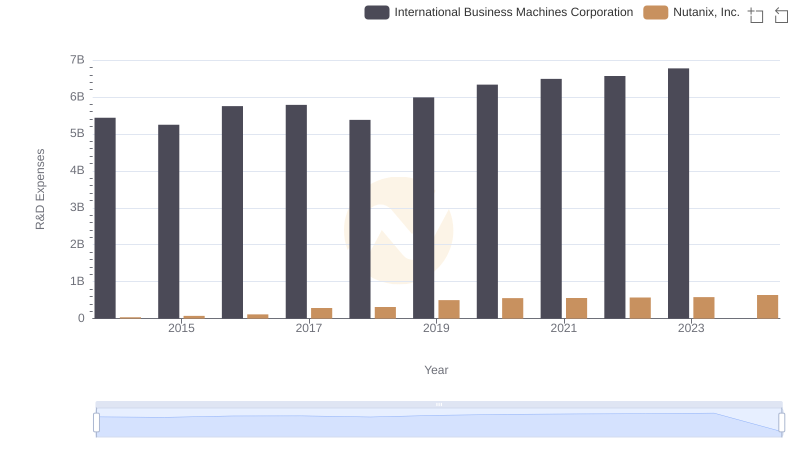
R&D Spending Showdown: International Business Machines Corporation vs Nutanix, Inc.
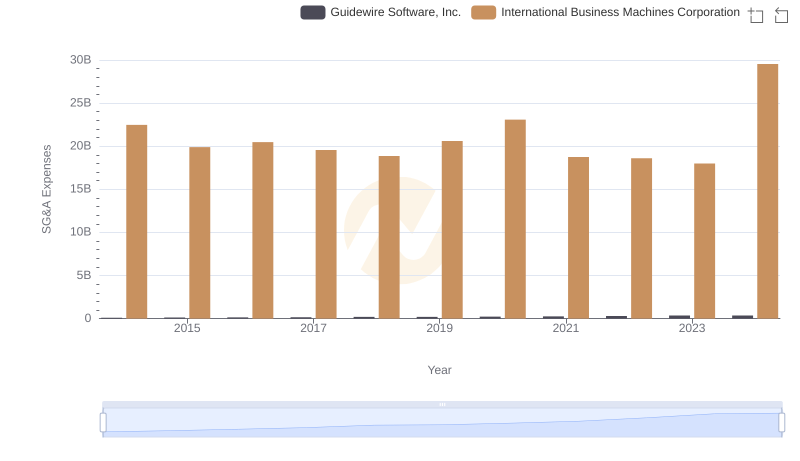
Breaking Down SG&A Expenses: International Business Machines Corporation vs Guidewire Software, Inc.