| __timestamp | Leidos Holdings, Inc. | Manhattan Associates, Inc. |
|---|---|---|
| Wednesday, January 1, 2014 | 310000000 | 97072000 |
| Thursday, January 1, 2015 | 232000000 | 97874000 |
| Friday, January 1, 2016 | 334000000 | 96545000 |
| Sunday, January 1, 2017 | 552000000 | 93536000 |
| Monday, January 1, 2018 | 729000000 | 103880000 |
| Tuesday, January 1, 2019 | 689000000 | 121463000 |
| Wednesday, January 1, 2020 | 770000000 | 109202000 |
| Friday, January 1, 2021 | 860000000 | 125941000 |
| Saturday, January 1, 2022 | 950000000 | 137607000 |
| Sunday, January 1, 2023 | 942000000 | 155664000 |
| Monday, January 1, 2024 | 983000000 | 165786000 |
Data in motion
In the ever-evolving landscape of corporate finance, understanding operational costs is crucial. Over the past decade, Leidos Holdings, Inc. and Manhattan Associates, Inc. have showcased distinct trajectories in their Selling, General, and Administrative (SG&A) expenses. Leidos, a leader in defense and information technology, saw its SG&A expenses surge by approximately 205% from 2014 to 2023, peaking in 2022. This growth reflects its strategic expansions and acquisitions. In contrast, Manhattan Associates, a supply chain solutions provider, experienced a more modest increase of around 60% in the same period, indicating a steady yet controlled growth strategy. The data highlights how industry demands and corporate strategies shape financial outcomes. As businesses navigate the complexities of the modern economy, these insights offer a window into the financial health and strategic priorities of two influential players.

Operational Costs Compared: SG&A Analysis of Apple Inc. and Leidos Holdings, Inc.
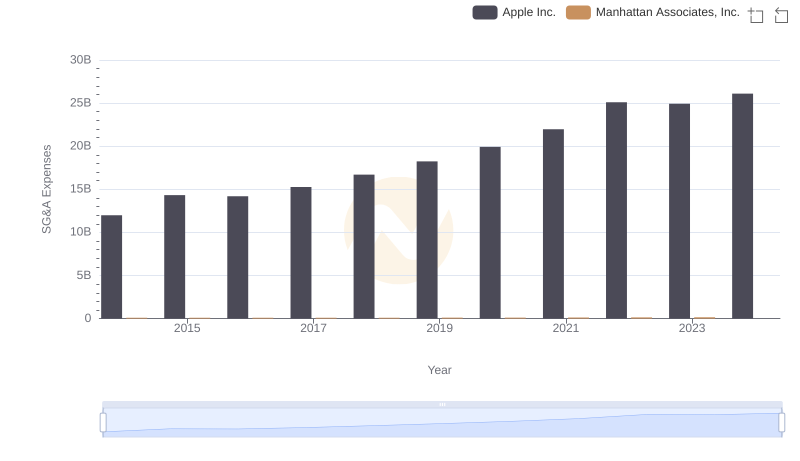
Cost Management Insights: SG&A Expenses for Apple Inc. and Manhattan Associates, Inc.
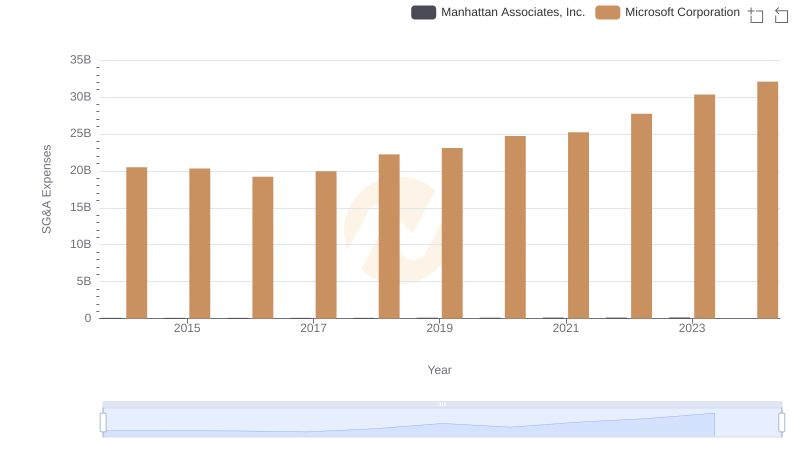
Selling, General, and Administrative Costs: Microsoft Corporation vs Manhattan Associates, Inc.
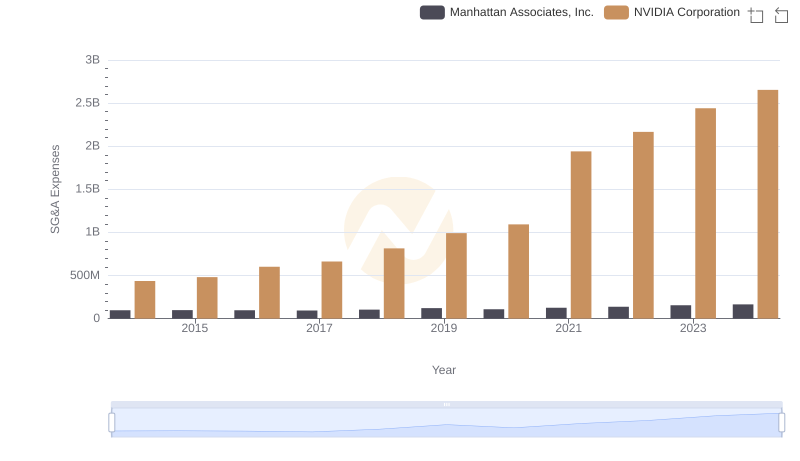
Who Optimizes SG&A Costs Better? NVIDIA Corporation or Manhattan Associates, Inc.
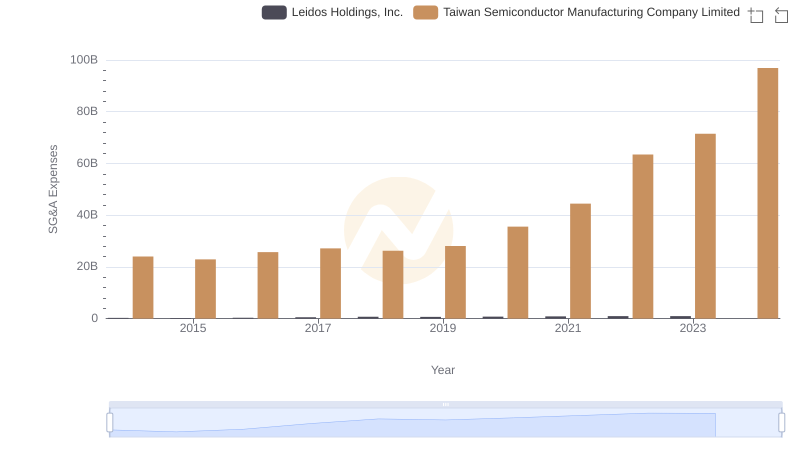
SG&A Efficiency Analysis: Comparing Taiwan Semiconductor Manufacturing Company Limited and Leidos Holdings, Inc.
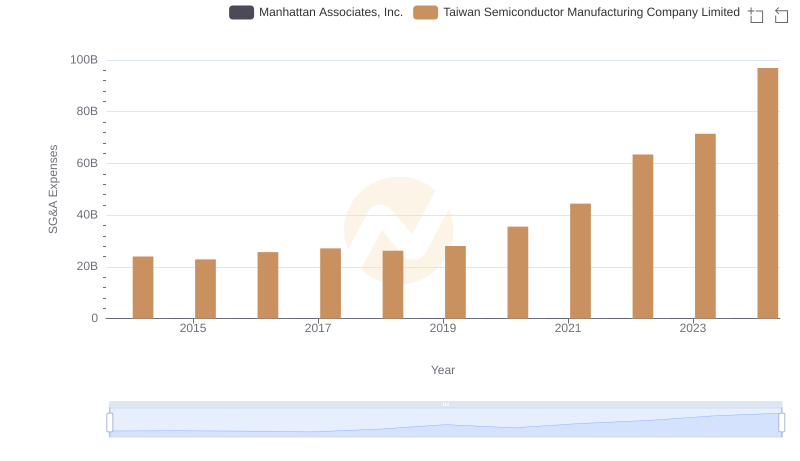
Who Optimizes SG&A Costs Better? Taiwan Semiconductor Manufacturing Company Limited or Manhattan Associates, Inc.
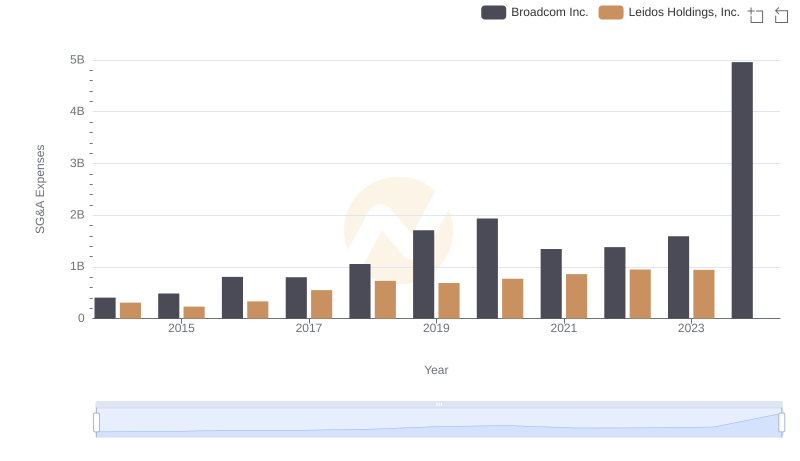
Who Optimizes SG&A Costs Better? Broadcom Inc. or Leidos Holdings, Inc.
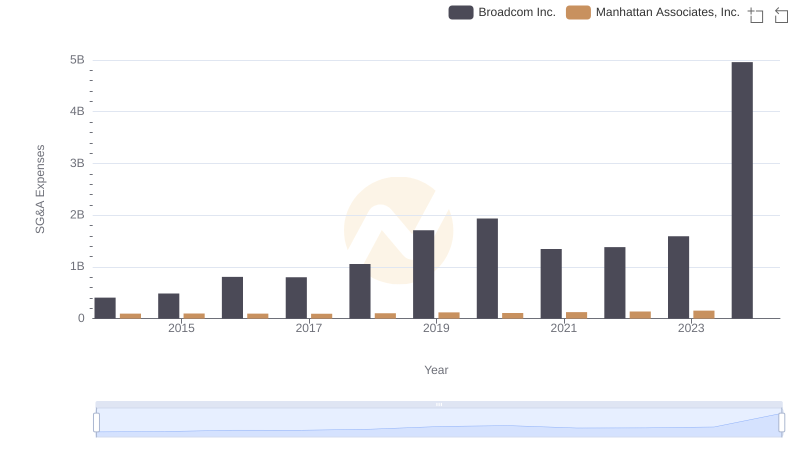
Comparing SG&A Expenses: Broadcom Inc. vs Manhattan Associates, Inc. Trends and Insights
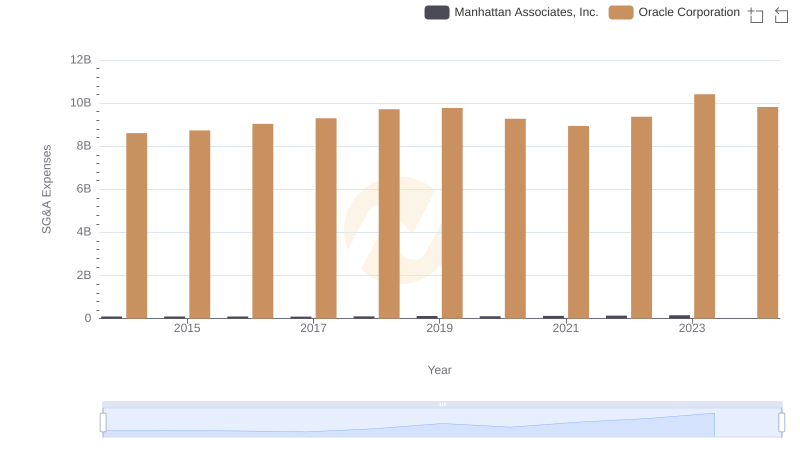
Oracle Corporation and Manhattan Associates, Inc.: SG&A Spending Patterns Compared
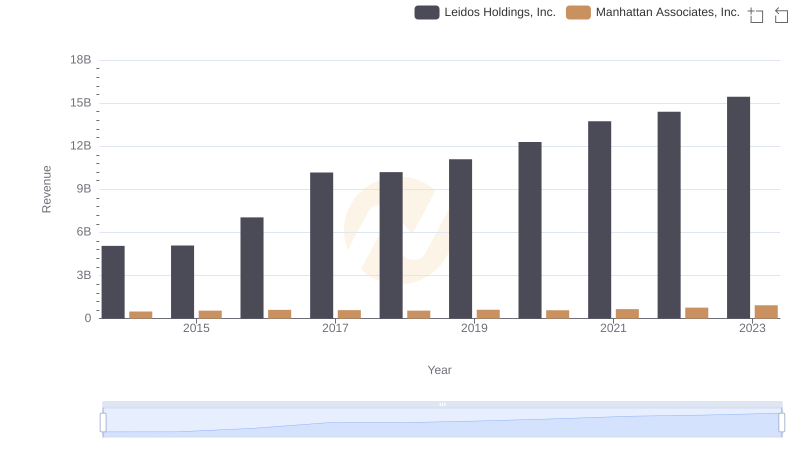
Leidos Holdings, Inc. vs Manhattan Associates, Inc.: Examining Key Revenue Metrics
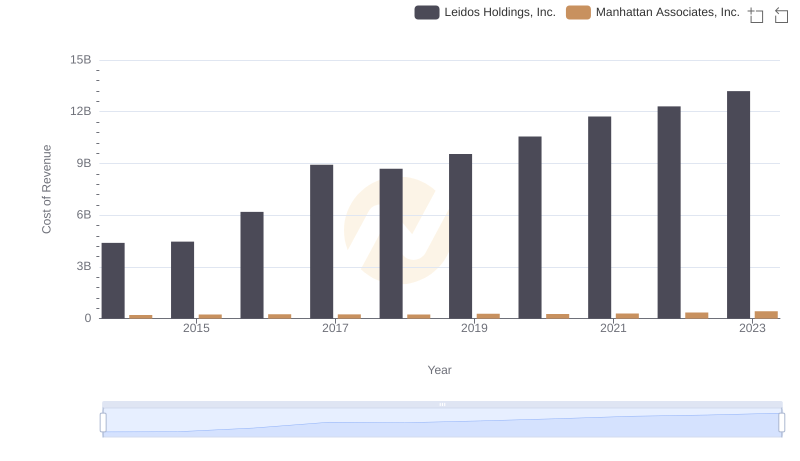
Cost Insights: Breaking Down Leidos Holdings, Inc. and Manhattan Associates, Inc.'s Expenses
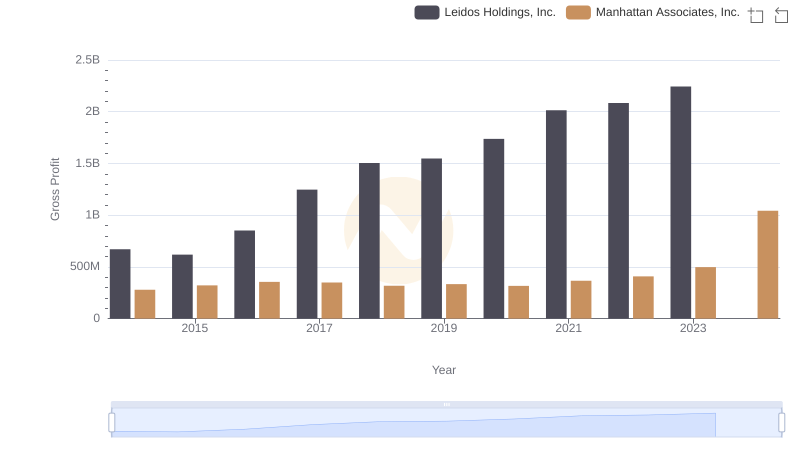
Key Insights on Gross Profit: Leidos Holdings, Inc. vs Manhattan Associates, Inc.