| __timestamp | Leidos Holdings, Inc. | Manhattan Associates, Inc. |
|---|---|---|
| Wednesday, January 1, 2014 | 4392000000 | 212578000 |
| Thursday, January 1, 2015 | 4468000000 | 235428000 |
| Friday, January 1, 2016 | 6191000000 | 249879000 |
| Sunday, January 1, 2017 | 8923000000 | 245733000 |
| Monday, January 1, 2018 | 8690000000 | 240881000 |
| Tuesday, January 1, 2019 | 9546000000 | 284967000 |
| Wednesday, January 1, 2020 | 10560000000 | 269887000 |
| Friday, January 1, 2021 | 11723000000 | 297827000 |
| Saturday, January 1, 2022 | 12312000000 | 358237000 |
| Sunday, January 1, 2023 | 13194000000 | 430614000 |
| Monday, January 1, 2024 | 13864000000 | 470980000 |
Unleashing insights
In the ever-evolving landscape of corporate finance, understanding cost structures is pivotal. Leidos Holdings, Inc. and Manhattan Associates, Inc. offer a fascinating study in contrasts. From 2014 to 2023, Leidos Holdings saw its cost of revenue surge by nearly 200%, peaking at approximately $13.2 billion in 2023. This reflects its expansive growth and operational scale. In contrast, Manhattan Associates maintained a more modest trajectory, with costs increasing by around 100% over the same period, reaching $430 million in 2023. This disparity highlights the differing business models and market strategies of these two companies. Notably, the data for 2024 is incomplete, suggesting a need for further analysis. As businesses navigate the complexities of cost management, these insights provide a window into strategic financial planning.
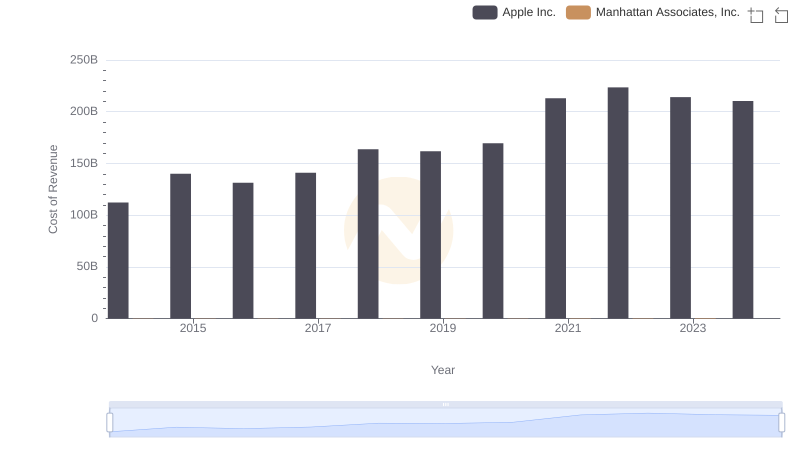
Comparing Cost of Revenue Efficiency: Apple Inc. vs Manhattan Associates, Inc.
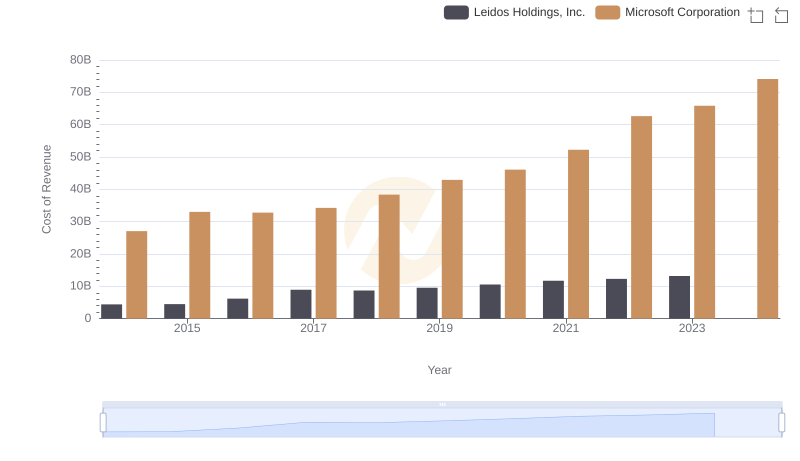
Cost of Revenue Trends: Microsoft Corporation vs Leidos Holdings, Inc.
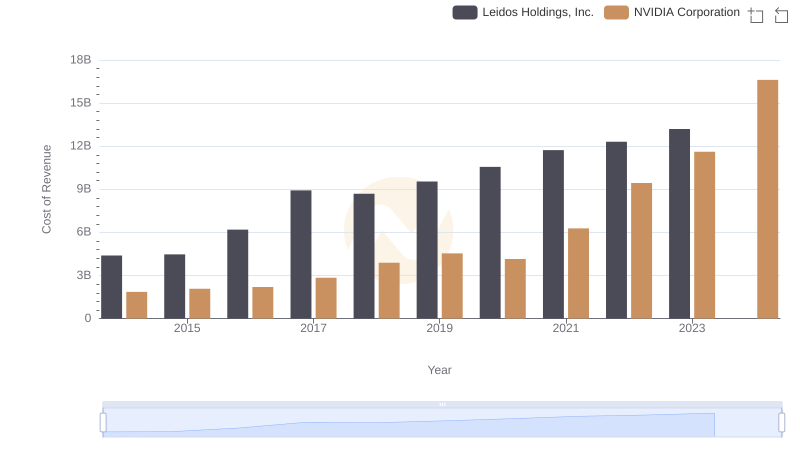
Analyzing Cost of Revenue: NVIDIA Corporation and Leidos Holdings, Inc.
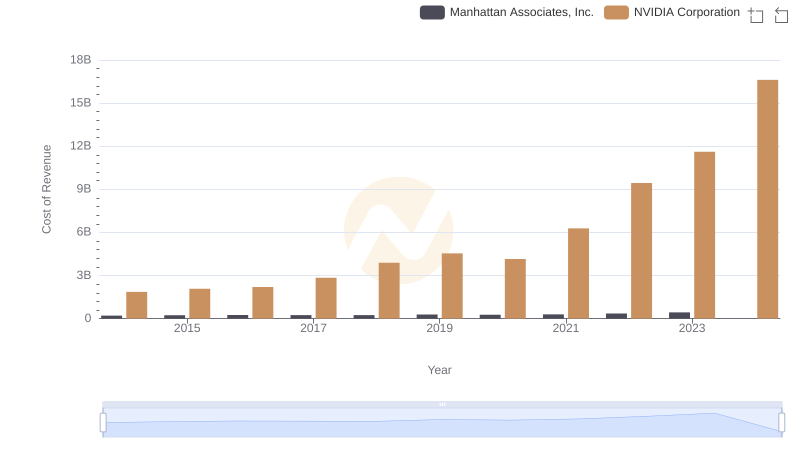
Cost of Revenue Comparison: NVIDIA Corporation vs Manhattan Associates, Inc.
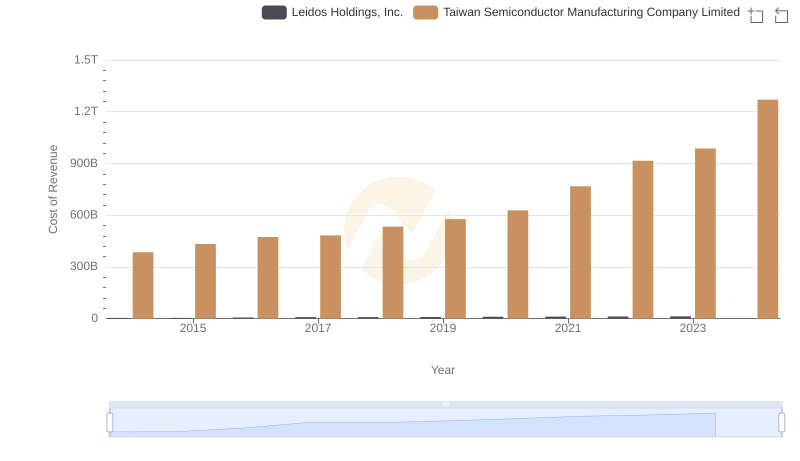
Comparing Cost of Revenue Efficiency: Taiwan Semiconductor Manufacturing Company Limited vs Leidos Holdings, Inc.
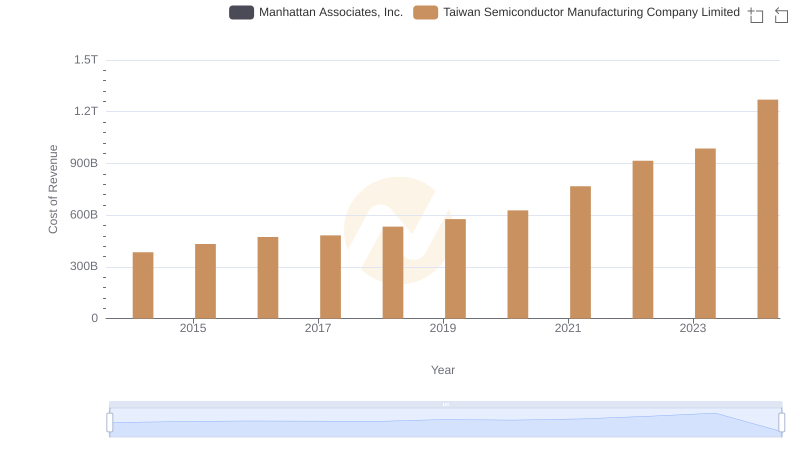
Cost of Revenue Trends: Taiwan Semiconductor Manufacturing Company Limited vs Manhattan Associates, Inc.
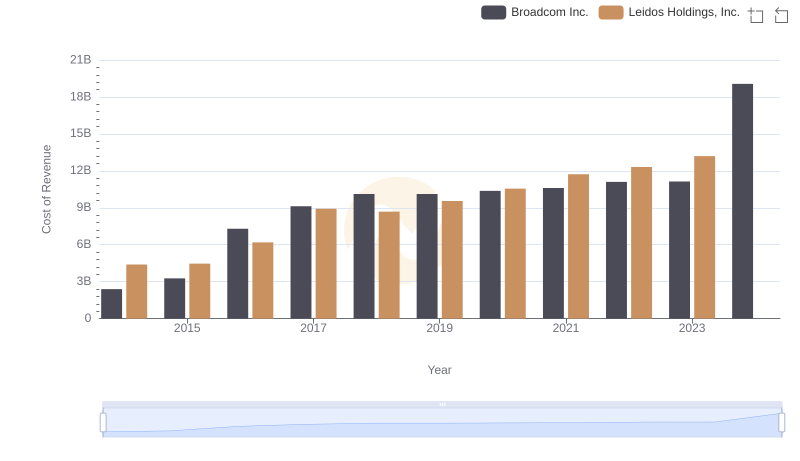
Cost Insights: Breaking Down Broadcom Inc. and Leidos Holdings, Inc.'s Expenses
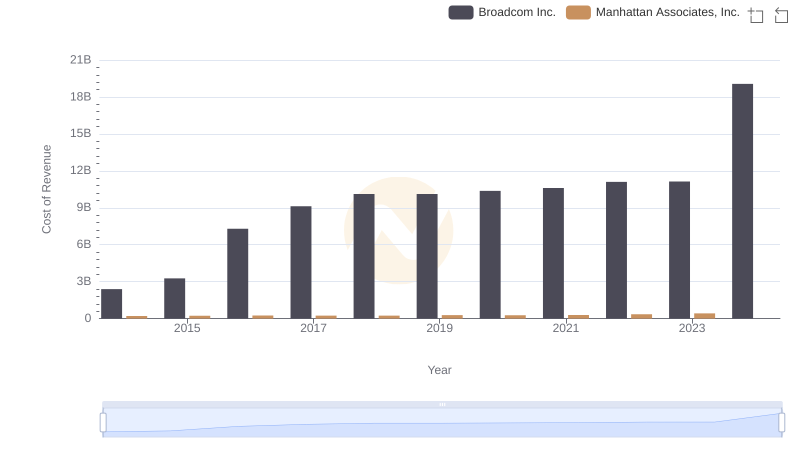
Cost of Revenue Trends: Broadcom Inc. vs Manhattan Associates, Inc.
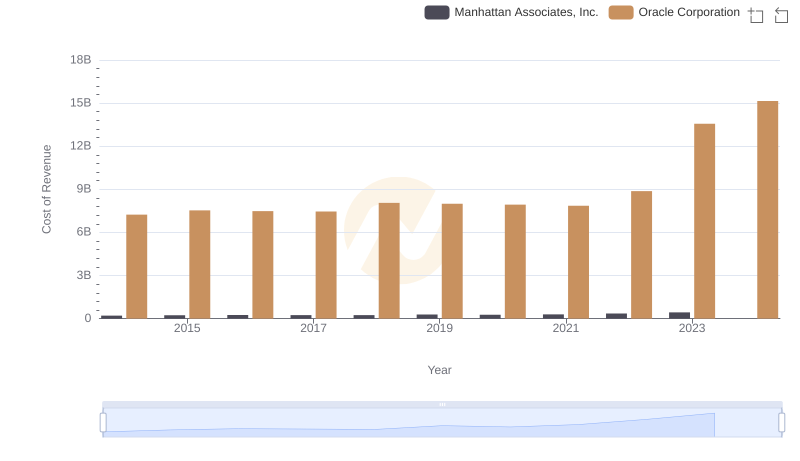
Cost of Revenue Comparison: Oracle Corporation vs Manhattan Associates, Inc.
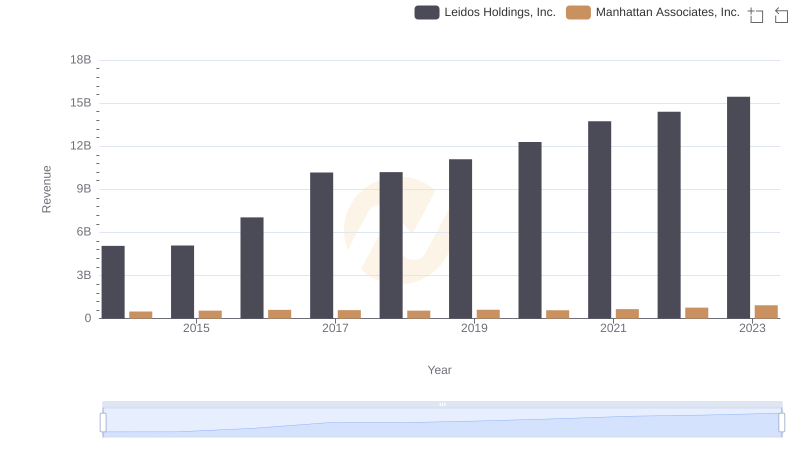
Leidos Holdings, Inc. vs Manhattan Associates, Inc.: Examining Key Revenue Metrics
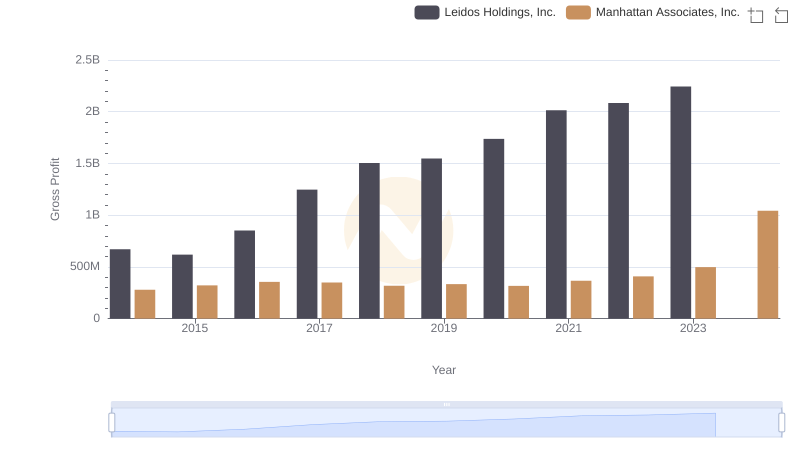
Key Insights on Gross Profit: Leidos Holdings, Inc. vs Manhattan Associates, Inc.
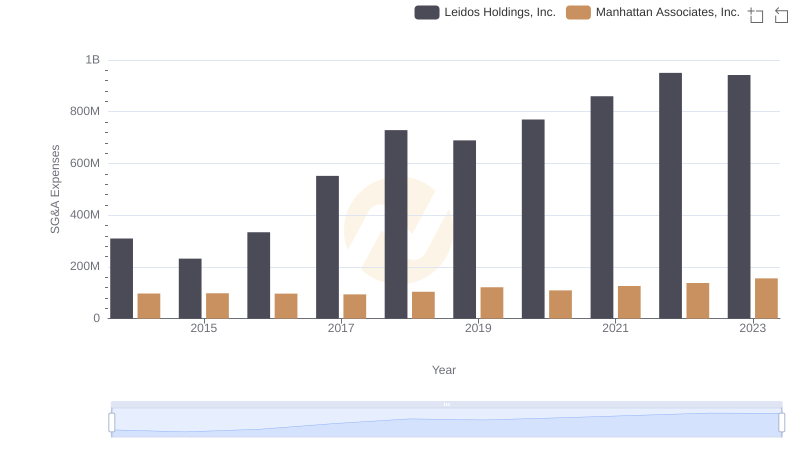
Operational Costs Compared: SG&A Analysis of Leidos Holdings, Inc. and Manhattan Associates, Inc.