| __timestamp | Leidos Holdings, Inc. | Manhattan Associates, Inc. |
|---|---|---|
| Wednesday, January 1, 2014 | 5063000000 | 492104000 |
| Thursday, January 1, 2015 | 5086000000 | 556371000 |
| Friday, January 1, 2016 | 7043000000 | 604557000 |
| Sunday, January 1, 2017 | 10170000000 | 594599000 |
| Monday, January 1, 2018 | 10194000000 | 559157000 |
| Tuesday, January 1, 2019 | 11094000000 | 617949000 |
| Wednesday, January 1, 2020 | 12297000000 | 586372000 |
| Friday, January 1, 2021 | 13737000000 | 663643000 |
| Saturday, January 1, 2022 | 14396000000 | 767084000 |
| Sunday, January 1, 2023 | 15438000000 | 928725000 |
| Monday, January 1, 2024 | 16662000000 | 1042352000 |
Data in motion
In the ever-evolving landscape of the U.S. stock market, Leidos Holdings, Inc. and Manhattan Associates, Inc. have carved distinct paths over the past decade. From 2014 to 2023, Leidos Holdings has seen a remarkable revenue growth of over 200%, starting from $5 billion and reaching approximately $15 billion. This growth trajectory underscores its robust expansion strategy and adaptability in a competitive market.
Conversely, Manhattan Associates, Inc. has experienced a steady yet modest increase in revenue, growing by nearly 90% from $492 million to $928 million. This growth reflects its consistent performance and strategic focus on niche markets.
The contrasting revenue trends of these two companies highlight the diverse strategies and market dynamics at play. As investors and analysts look to the future, these insights provide a valuable lens through which to assess potential opportunities and risks.
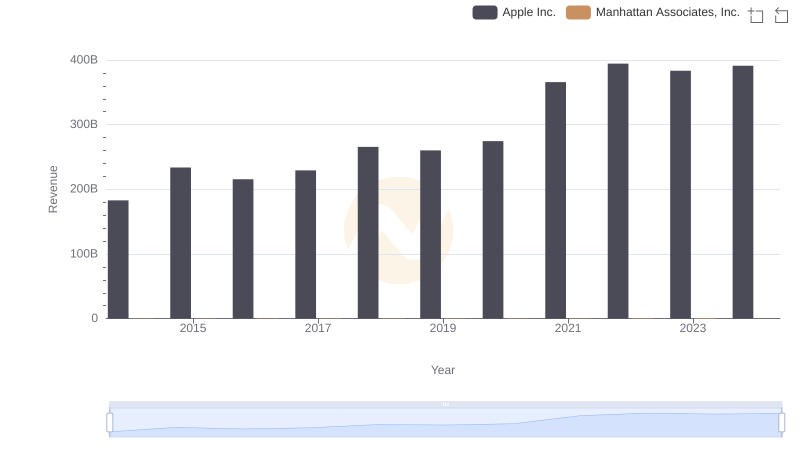
Breaking Down Revenue Trends: Apple Inc. vs Manhattan Associates, Inc.
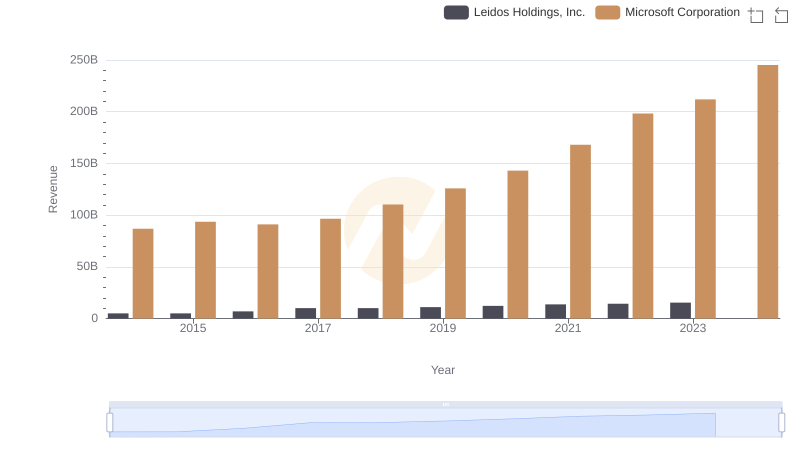
Comparing Revenue Performance: Microsoft Corporation or Leidos Holdings, Inc.?
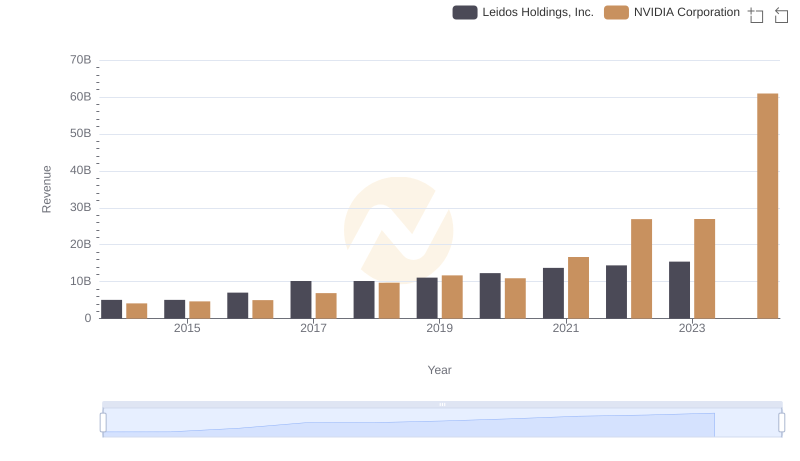
NVIDIA Corporation vs Leidos Holdings, Inc.: Examining Key Revenue Metrics
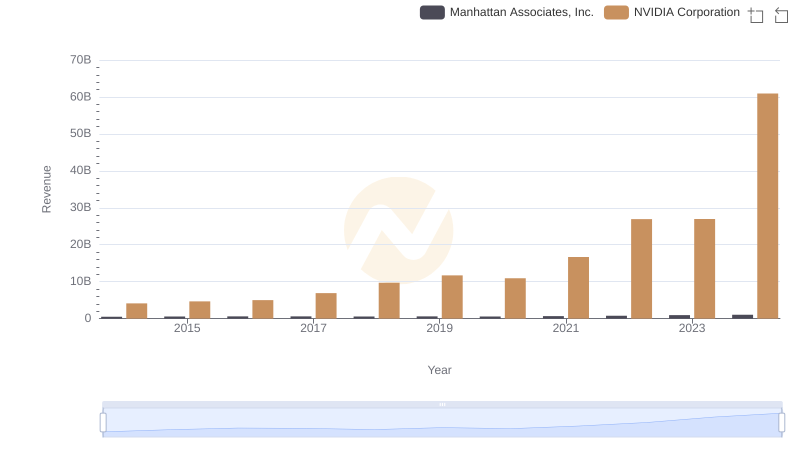
Revenue Showdown: NVIDIA Corporation vs Manhattan Associates, Inc.
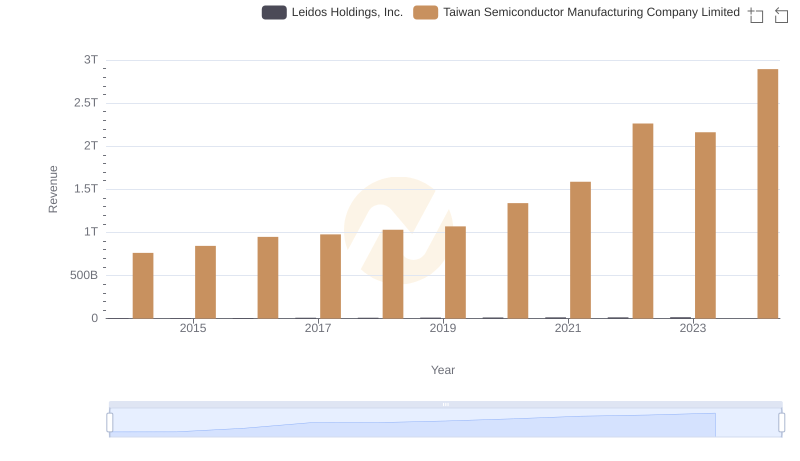
Revenue Showdown: Taiwan Semiconductor Manufacturing Company Limited vs Leidos Holdings, Inc.
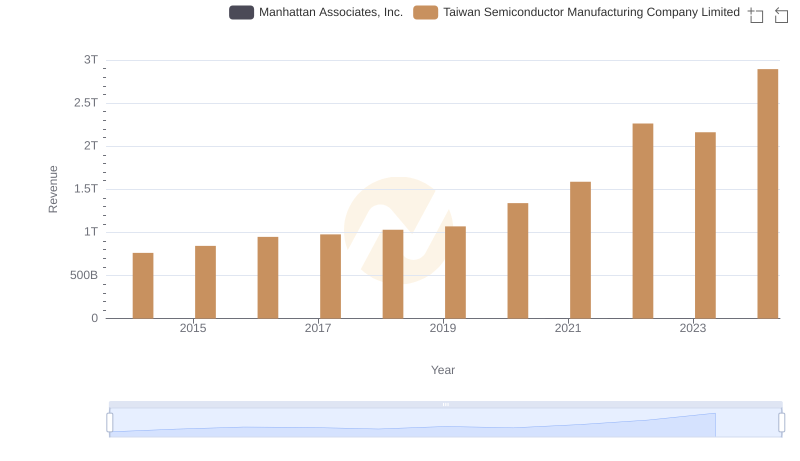
Breaking Down Revenue Trends: Taiwan Semiconductor Manufacturing Company Limited vs Manhattan Associates, Inc.
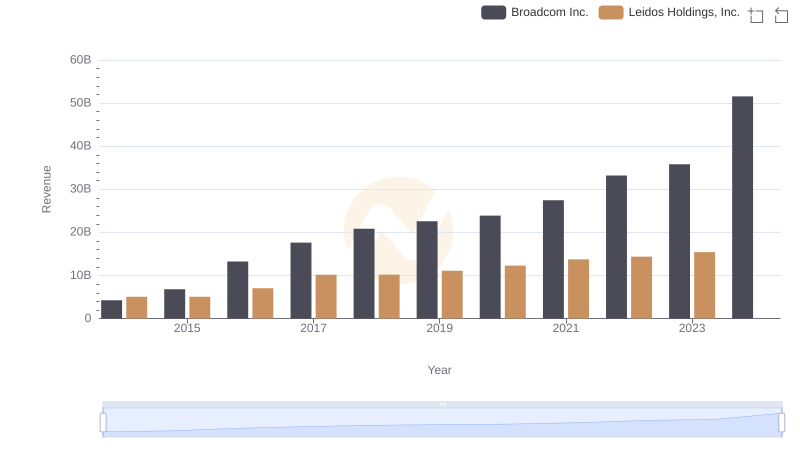
Broadcom Inc. vs Leidos Holdings, Inc.: Examining Key Revenue Metrics
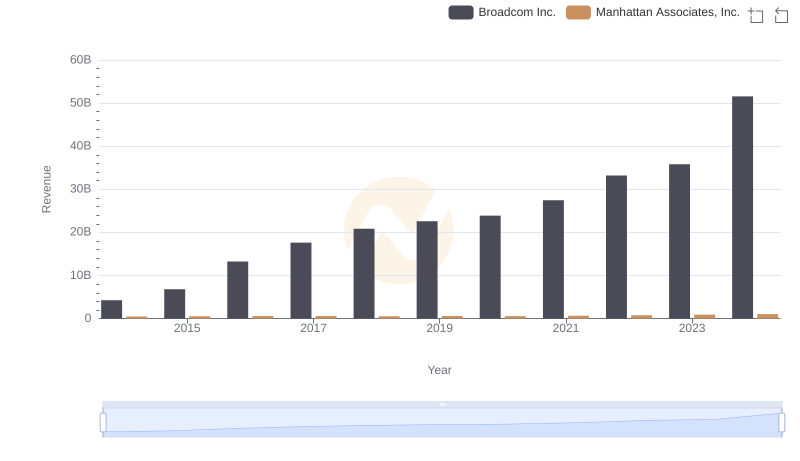
Broadcom Inc. or Manhattan Associates, Inc.: Who Leads in Yearly Revenue?
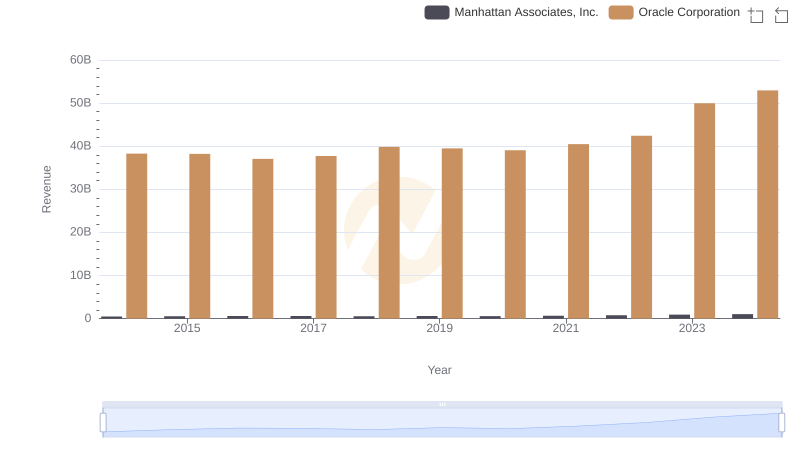
Revenue Insights: Oracle Corporation and Manhattan Associates, Inc. Performance Compared
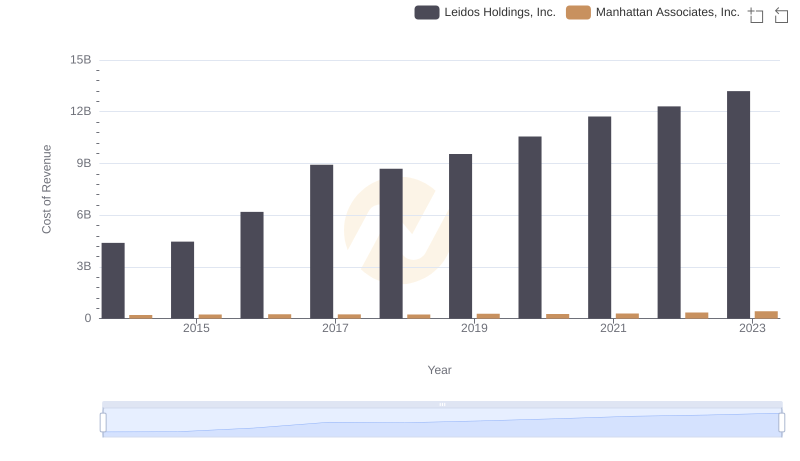
Cost Insights: Breaking Down Leidos Holdings, Inc. and Manhattan Associates, Inc.'s Expenses
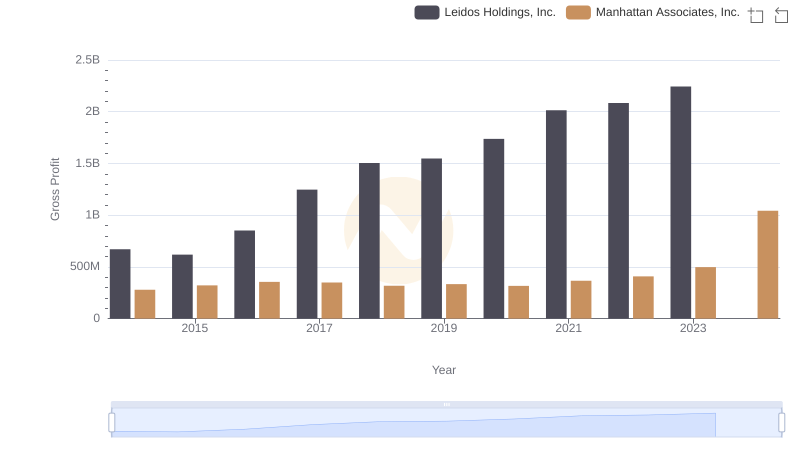
Key Insights on Gross Profit: Leidos Holdings, Inc. vs Manhattan Associates, Inc.
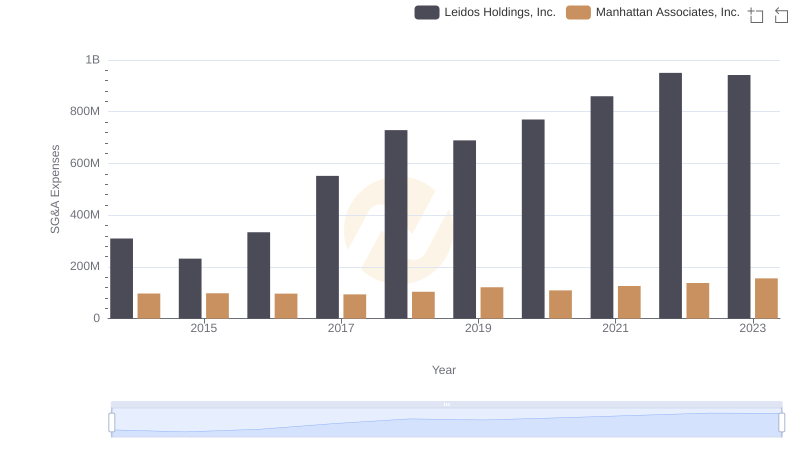
Operational Costs Compared: SG&A Analysis of Leidos Holdings, Inc. and Manhattan Associates, Inc.