| __timestamp | Ferguson plc | Old Dominion Freight Line, Inc. |
|---|---|---|
| Wednesday, January 1, 2014 | 22198928094 | 2787897000 |
| Thursday, January 1, 2015 | 20800698973 | 2972442000 |
| Friday, January 1, 2016 | 19066872795 | 2991517000 |
| Sunday, January 1, 2017 | 20009463224 | 3358112000 |
| Monday, January 1, 2018 | 20752000000 | 4043695000 |
| Tuesday, January 1, 2019 | 22010000000 | 4109111000 |
| Wednesday, January 1, 2020 | 21819000000 | 4015129000 |
| Friday, January 1, 2021 | 22792000000 | 5256328000 |
| Saturday, January 1, 2022 | 28566000000 | 6260077000 |
| Sunday, January 1, 2023 | 29734000000 | 5866152000 |
| Monday, January 1, 2024 | 29635000000 |
Data in motion
In the ever-evolving landscape of global commerce, two industry titans, Old Dominion Freight Line, Inc. and Ferguson plc, have showcased remarkable revenue trajectories over the past decade. From 2014 to 2023, Ferguson plc's revenue surged by approximately 34%, peaking in 2023. Meanwhile, Old Dominion Freight Line, Inc. experienced a robust growth of around 110% during the same period, highlighting its dynamic expansion in the freight industry.
Ferguson plc, a leader in the building materials sector, saw a steady climb in revenue, with a notable leap in 2022. In contrast, Old Dominion Freight Line, Inc., a key player in freight logistics, demonstrated consistent growth, with a significant spike in 2021. However, data for 2024 remains incomplete, leaving room for speculation on future trends.
These insights underscore the resilience and adaptability of these companies in navigating economic shifts and market demands.
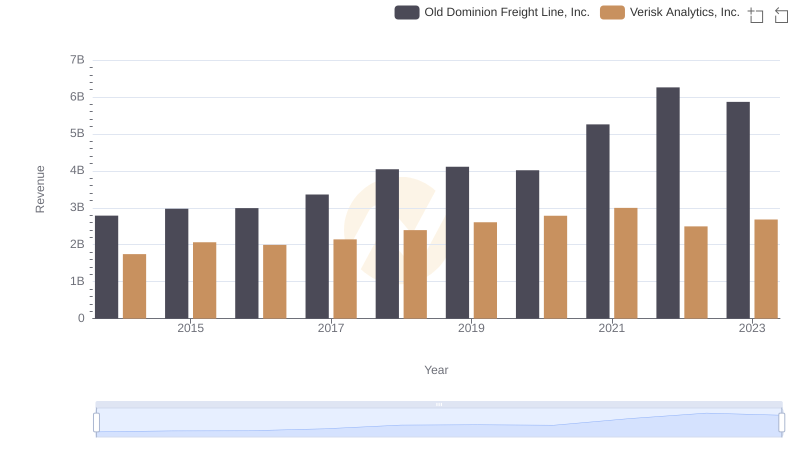
Old Dominion Freight Line, Inc. vs Verisk Analytics, Inc.: Examining Key Revenue Metrics
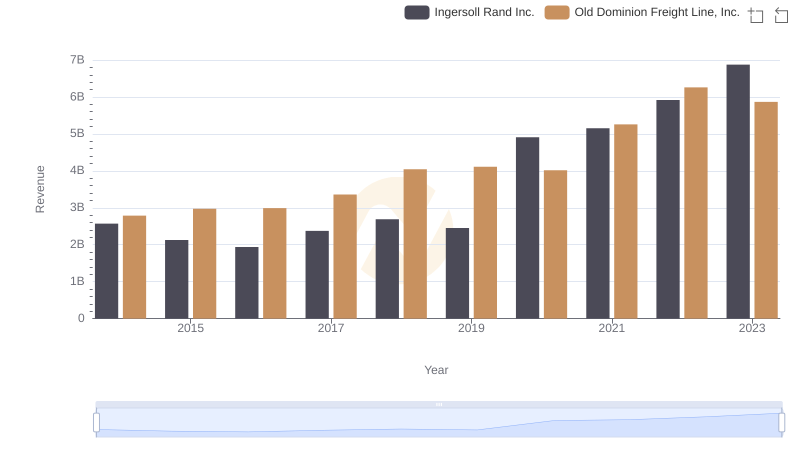
Old Dominion Freight Line, Inc. vs Ingersoll Rand Inc.: Examining Key Revenue Metrics
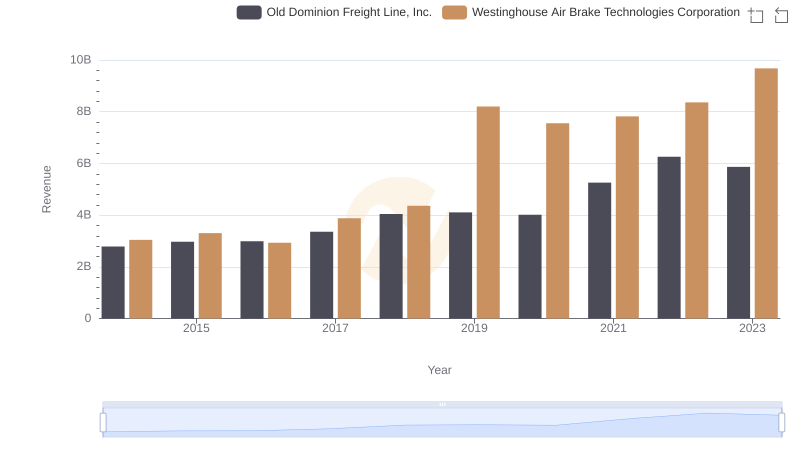
Who Generates More Revenue? Old Dominion Freight Line, Inc. or Westinghouse Air Brake Technologies Corporation
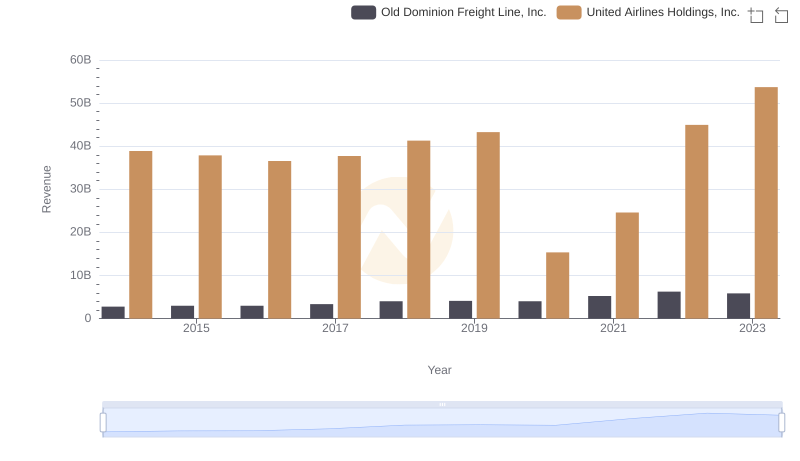
Who Generates More Revenue? Old Dominion Freight Line, Inc. or United Airlines Holdings, Inc.
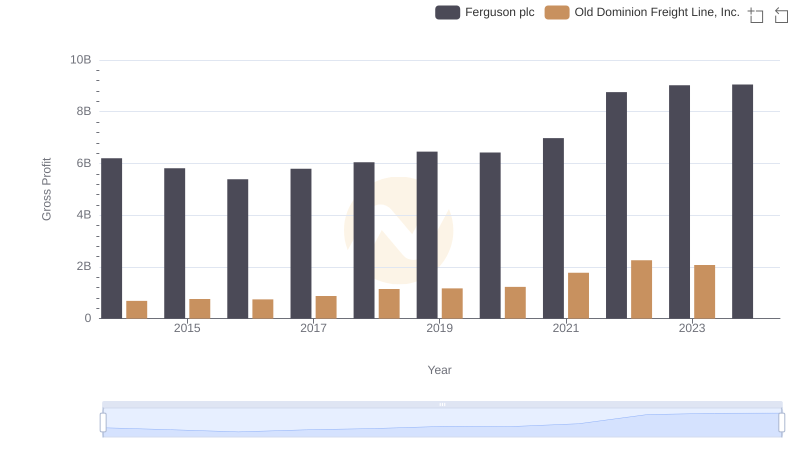
Key Insights on Gross Profit: Old Dominion Freight Line, Inc. vs Ferguson plc
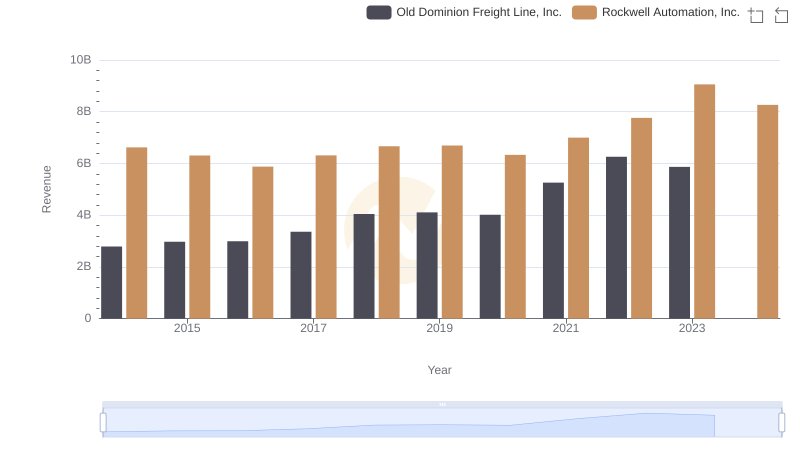
Breaking Down Revenue Trends: Old Dominion Freight Line, Inc. vs Rockwell Automation, Inc.
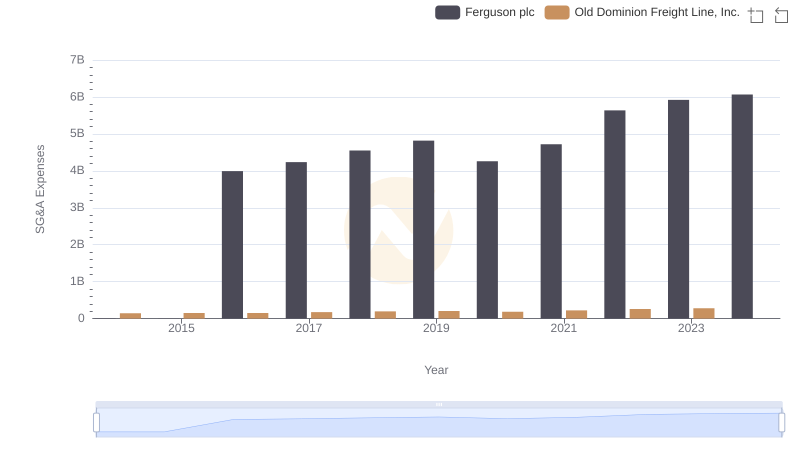
Cost Management Insights: SG&A Expenses for Old Dominion Freight Line, Inc. and Ferguson plc
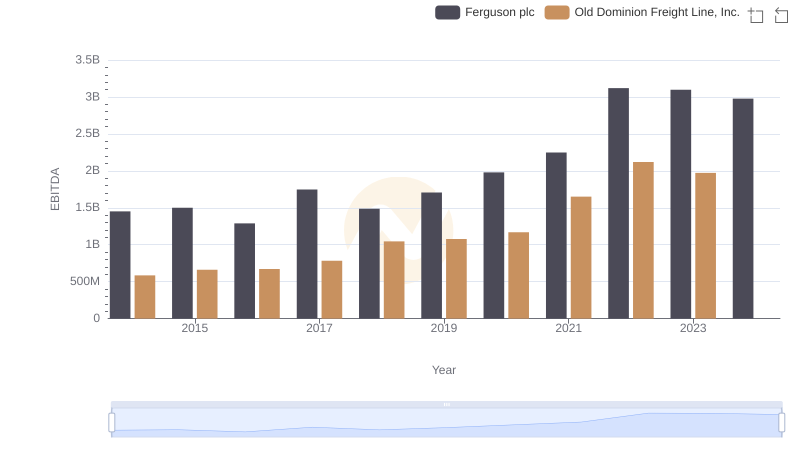
Old Dominion Freight Line, Inc. vs Ferguson plc: In-Depth EBITDA Performance Comparison