| __timestamp | Ferguson plc | Old Dominion Freight Line, Inc. |
|---|---|---|
| Wednesday, January 1, 2014 | 6203188666 | 687488000 |
| Thursday, January 1, 2015 | 5816457079 | 757499000 |
| Friday, January 1, 2016 | 5389727937 | 744627000 |
| Sunday, January 1, 2017 | 5793596551 | 875380000 |
| Monday, January 1, 2018 | 6044000000 | 1144243000 |
| Tuesday, January 1, 2019 | 6458000000 | 1170216000 |
| Wednesday, January 1, 2020 | 6421000000 | 1228598000 |
| Friday, January 1, 2021 | 6980000000 | 1775060000 |
| Saturday, January 1, 2022 | 8756000000 | 2256126000 |
| Sunday, January 1, 2023 | 9025000000 | 2072199000 |
| Monday, January 1, 2024 | 9053000000 |
Unlocking the unknown
In the competitive landscape of global logistics and distribution, Old Dominion Freight Line, Inc. and Ferguson plc stand as titans. Over the past decade, Ferguson plc has consistently outperformed with a gross profit averaging around $6.9 billion annually, peaking at $9.05 billion in 2024. Meanwhile, Old Dominion Freight Line, Inc. has shown impressive growth, with its gross profit surging from $687 million in 2014 to over $2 billion in 2023, marking a remarkable 200% increase.
Despite Ferguson's larger scale, Old Dominion's rapid growth trajectory highlights its strategic prowess in the freight industry. The data from 2024 is incomplete for Old Dominion, suggesting potential for further insights. As these companies continue to evolve, their financial narratives offer valuable lessons in resilience and adaptation in the ever-changing market landscape.
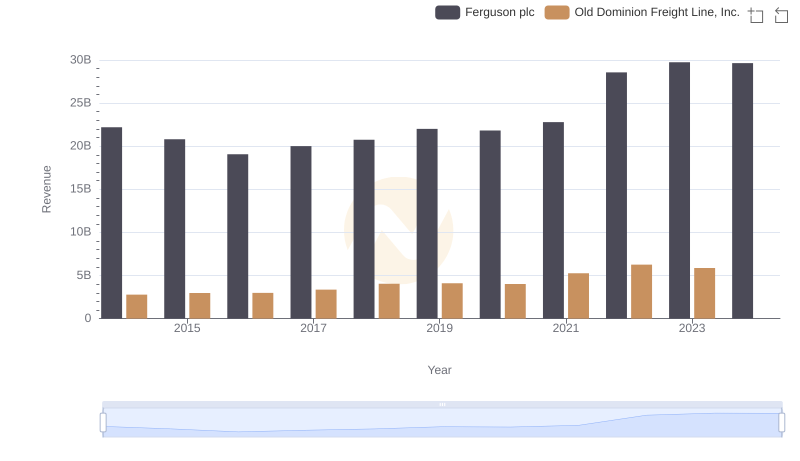
Old Dominion Freight Line, Inc. vs Ferguson plc: Annual Revenue Growth Compared
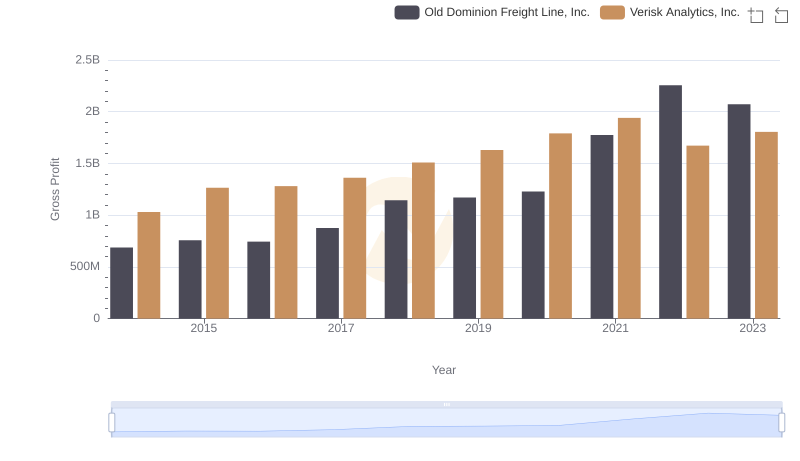
Gross Profit Analysis: Comparing Old Dominion Freight Line, Inc. and Verisk Analytics, Inc.
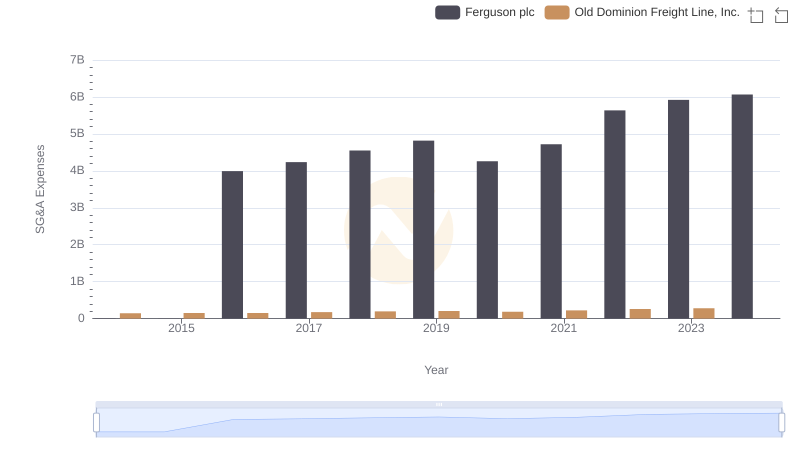
Cost Management Insights: SG&A Expenses for Old Dominion Freight Line, Inc. and Ferguson plc
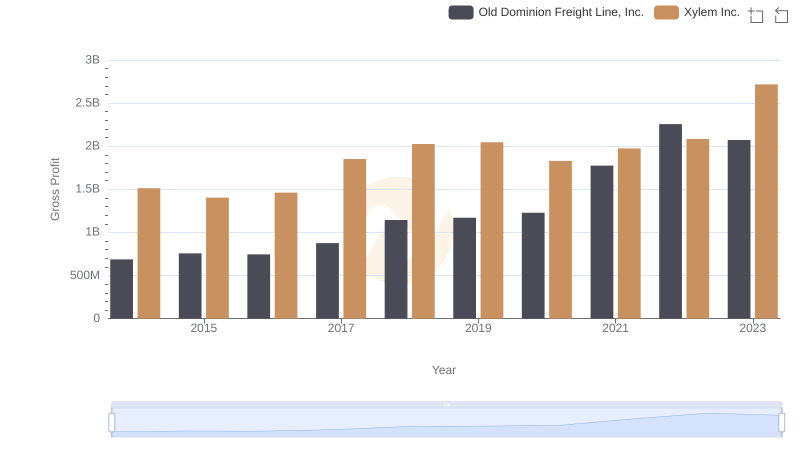
Who Generates Higher Gross Profit? Old Dominion Freight Line, Inc. or Xylem Inc.
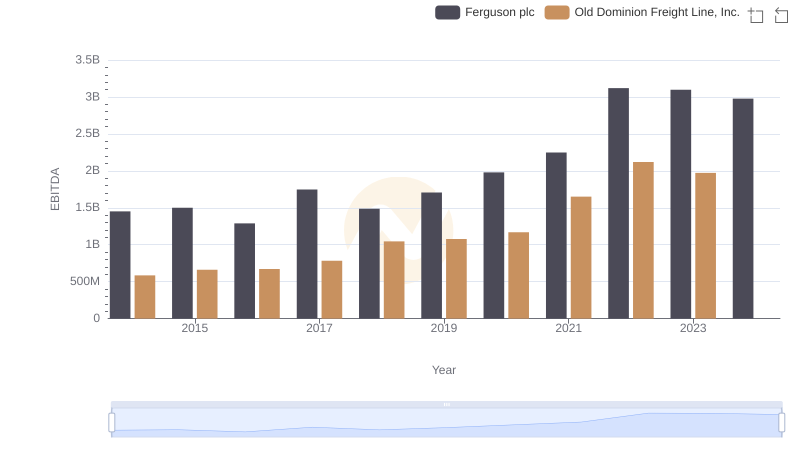
Old Dominion Freight Line, Inc. vs Ferguson plc: In-Depth EBITDA Performance Comparison
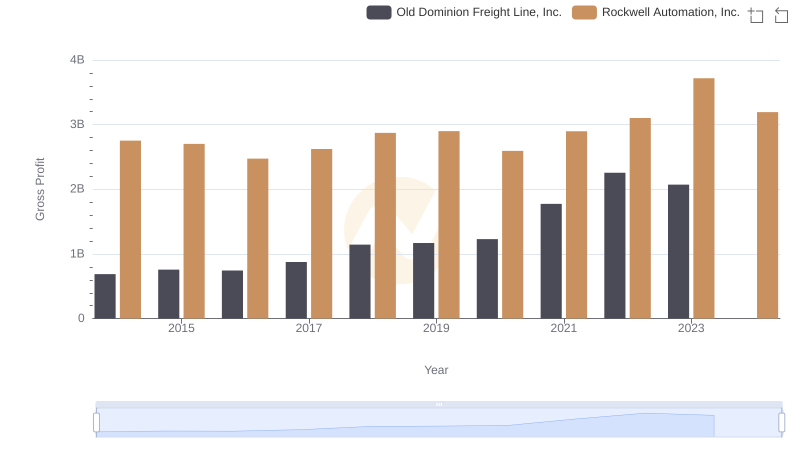
Key Insights on Gross Profit: Old Dominion Freight Line, Inc. vs Rockwell Automation, Inc.
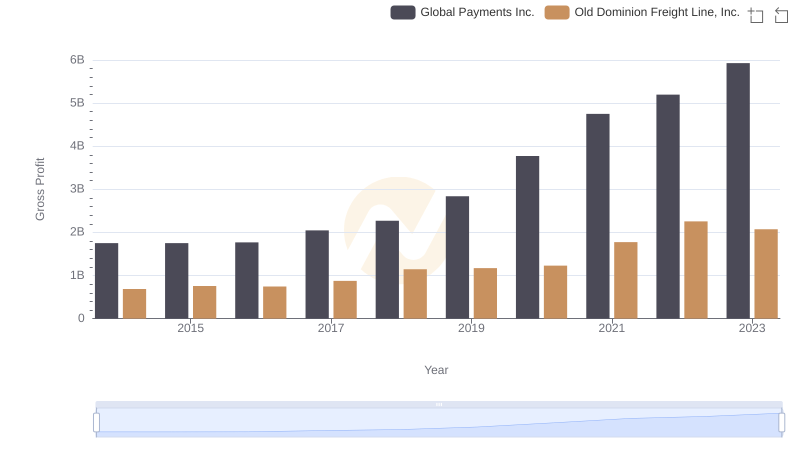
Who Generates Higher Gross Profit? Old Dominion Freight Line, Inc. or Global Payments Inc.