| __timestamp | American Airlines Group Inc. | Old Dominion Freight Line, Inc. |
|---|---|---|
| Wednesday, January 1, 2014 | 42650000000 | 2787897000 |
| Thursday, January 1, 2015 | 40990000000 | 2972442000 |
| Friday, January 1, 2016 | 40180000000 | 2991517000 |
| Sunday, January 1, 2017 | 42207000000 | 3358112000 |
| Monday, January 1, 2018 | 44541000000 | 4043695000 |
| Tuesday, January 1, 2019 | 45768000000 | 4109111000 |
| Wednesday, January 1, 2020 | 17337000000 | 4015129000 |
| Friday, January 1, 2021 | 29882000000 | 5256328000 |
| Saturday, January 1, 2022 | 48971000000 | 6260077000 |
| Sunday, January 1, 2023 | 52788000000 | 5866152000 |
Igniting the spark of knowledge
In the ever-evolving landscape of American commerce, transportation titans Old Dominion Freight Line and American Airlines Group have carved distinct paths. From 2014 to 2023, American Airlines' revenue soared by approximately 24%, peaking in 2023 with a staggering $52.8 billion. This growth trajectory underscores the airline's resilience, especially after a significant dip in 2020, when revenue plummeted to $17.3 billion due to global disruptions.
Conversely, Old Dominion Freight Line, a leader in freight logistics, showcased a steady ascent, with revenue climbing by 110% over the same period. By 2022, the company achieved its highest revenue of $6.26 billion, reflecting its robust operational strategies and market adaptability.
This comparative analysis highlights the dynamic nature of the transportation sector, where adaptability and strategic foresight are key to thriving in a competitive market.
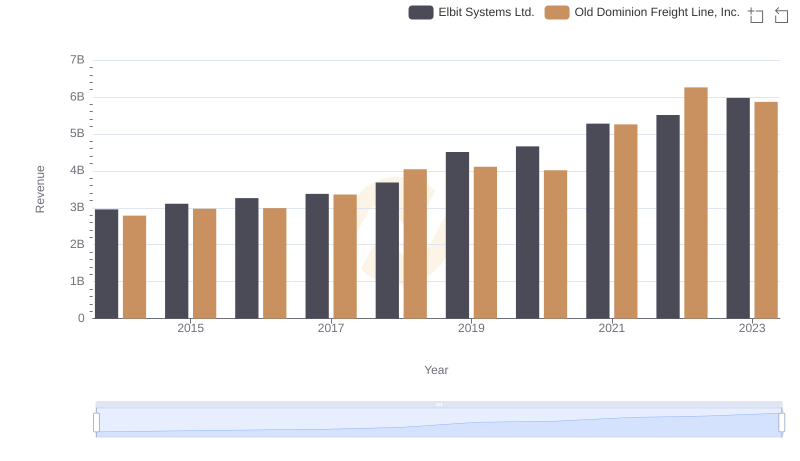
Old Dominion Freight Line, Inc. vs Elbit Systems Ltd.: Annual Revenue Growth Compared
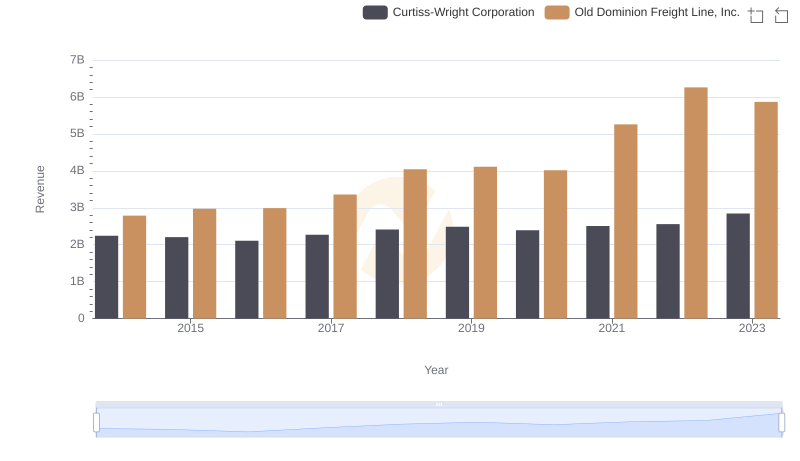
Annual Revenue Comparison: Old Dominion Freight Line, Inc. vs Curtiss-Wright Corporation
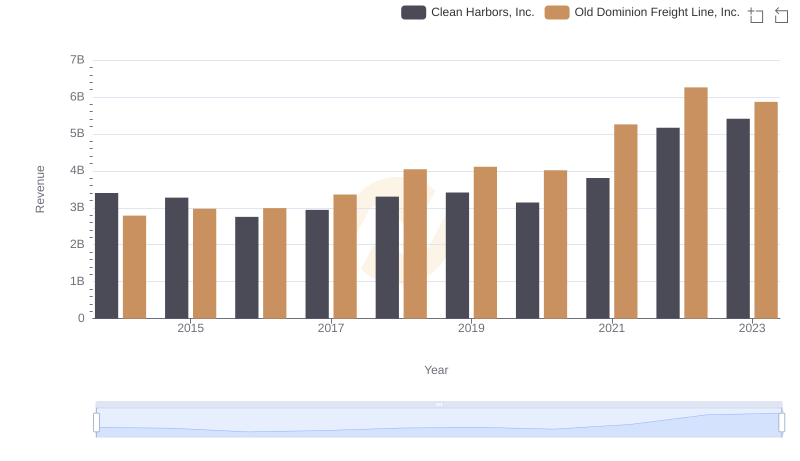
Breaking Down Revenue Trends: Old Dominion Freight Line, Inc. vs Clean Harbors, Inc.
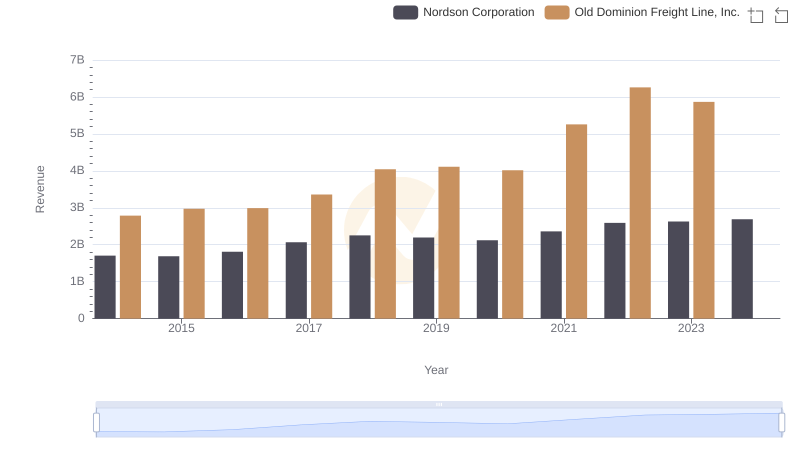
Old Dominion Freight Line, Inc. vs Nordson Corporation: Annual Revenue Growth Compared
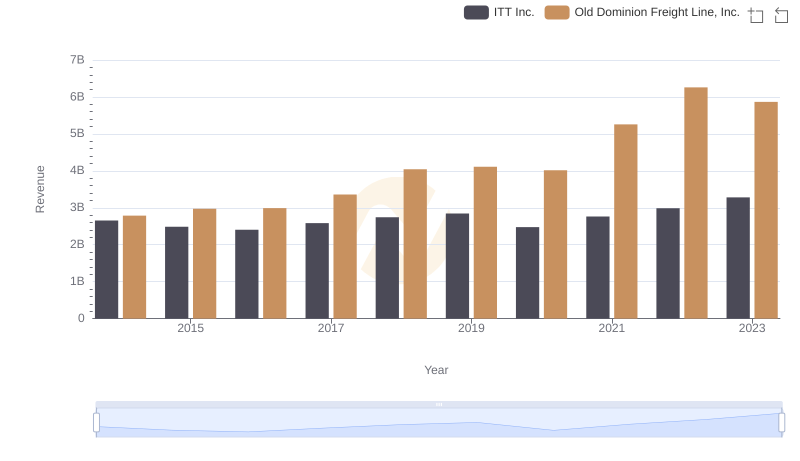
Annual Revenue Comparison: Old Dominion Freight Line, Inc. vs ITT Inc.
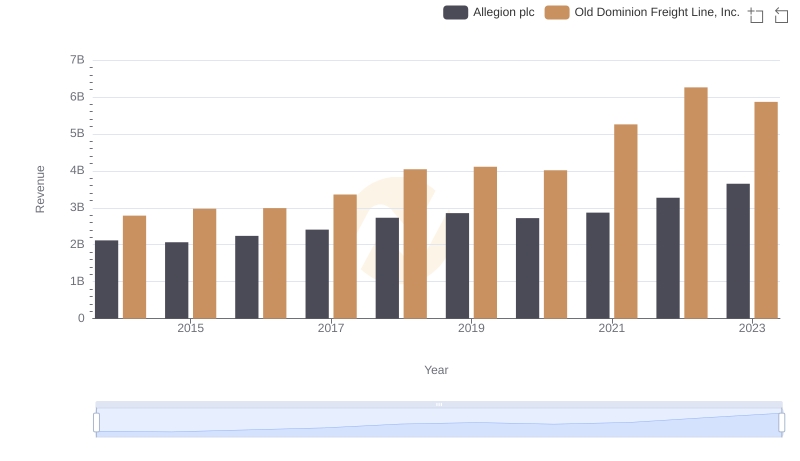
Revenue Insights: Old Dominion Freight Line, Inc. and Allegion plc Performance Compared
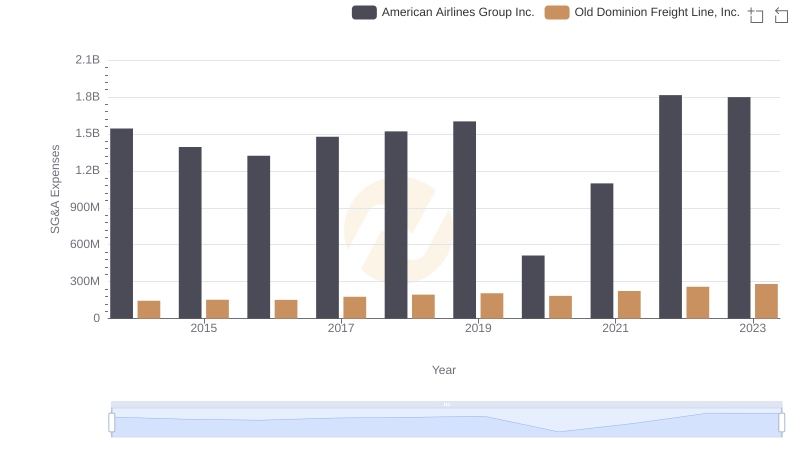
Old Dominion Freight Line, Inc. and American Airlines Group Inc.: SG&A Spending Patterns Compared