| __timestamp | American Airlines Group Inc. | Old Dominion Freight Line, Inc. |
|---|---|---|
| Wednesday, January 1, 2014 | 1544000000 | 144817000 |
| Thursday, January 1, 2015 | 1394000000 | 153589000 |
| Friday, January 1, 2016 | 1323000000 | 152391000 |
| Sunday, January 1, 2017 | 1477000000 | 177205000 |
| Monday, January 1, 2018 | 1520000000 | 194368000 |
| Tuesday, January 1, 2019 | 1602000000 | 206125000 |
| Wednesday, January 1, 2020 | 513000000 | 184185000 |
| Friday, January 1, 2021 | 1098000000 | 223757000 |
| Saturday, January 1, 2022 | 1815000000 | 258883000 |
| Sunday, January 1, 2023 | 1799000000 | 281053000 |
Data in motion
In the world of corporate finance, Selling, General, and Administrative (SG&A) expenses are a critical measure of operational efficiency. This article delves into the SG&A spending patterns of two industry giants: Old Dominion Freight Line, Inc. and American Airlines Group Inc., from 2014 to 2023.
Old Dominion Freight Line, a leader in the freight industry, has shown a steady increase in SG&A expenses, growing by approximately 94% over the decade. This reflects their strategic investments in infrastructure and technology to enhance service delivery. In contrast, American Airlines, a titan in the aviation sector, experienced a more volatile SG&A trajectory, with a notable dip in 2020, likely due to the pandemic's impact on air travel. However, by 2023, their SG&A expenses rebounded to near pre-pandemic levels, indicating a recovery in the aviation industry.
These trends highlight the distinct challenges and strategies within the freight and aviation sectors, offering valuable insights for investors and industry analysts.
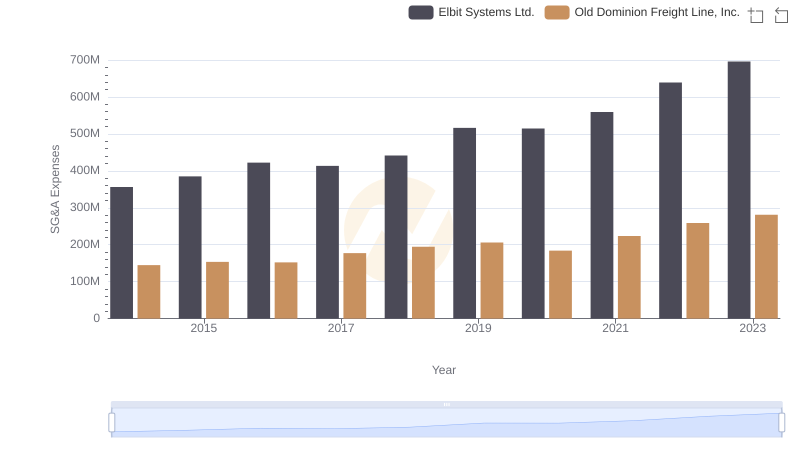
Cost Management Insights: SG&A Expenses for Old Dominion Freight Line, Inc. and Elbit Systems Ltd.
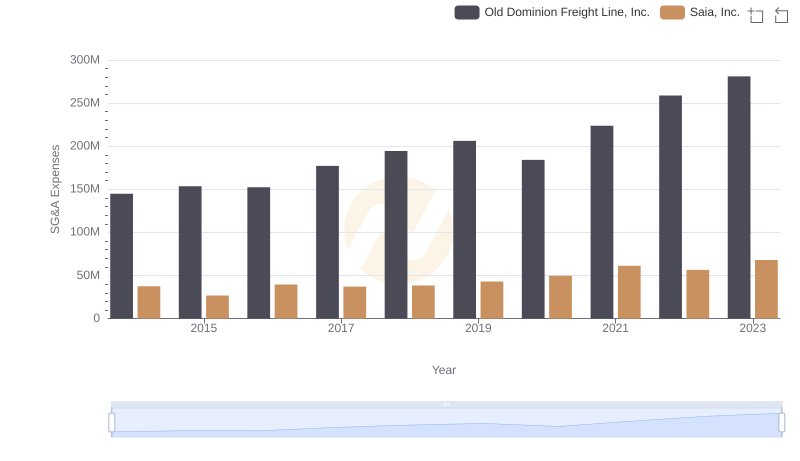
Breaking Down SG&A Expenses: Old Dominion Freight Line, Inc. vs Saia, Inc.
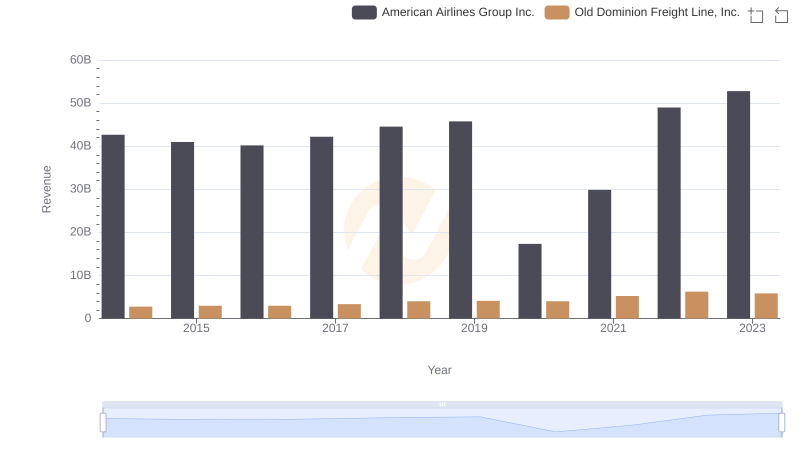
Old Dominion Freight Line, Inc. vs American Airlines Group Inc.: Examining Key Revenue Metrics
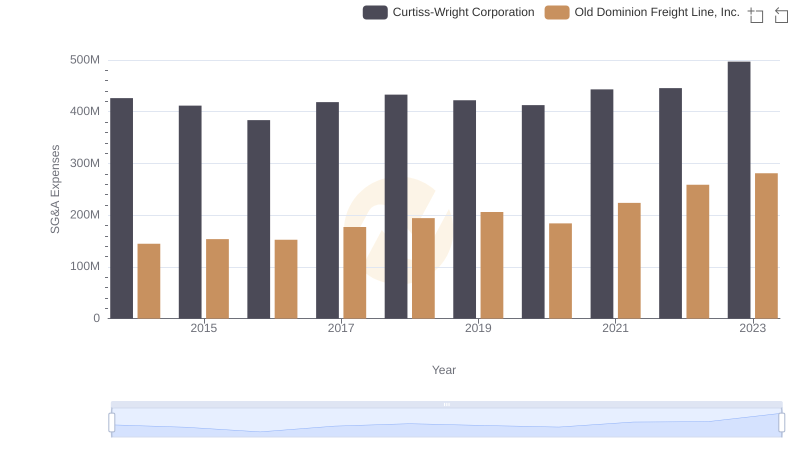
Cost Management Insights: SG&A Expenses for Old Dominion Freight Line, Inc. and Curtiss-Wright Corporation
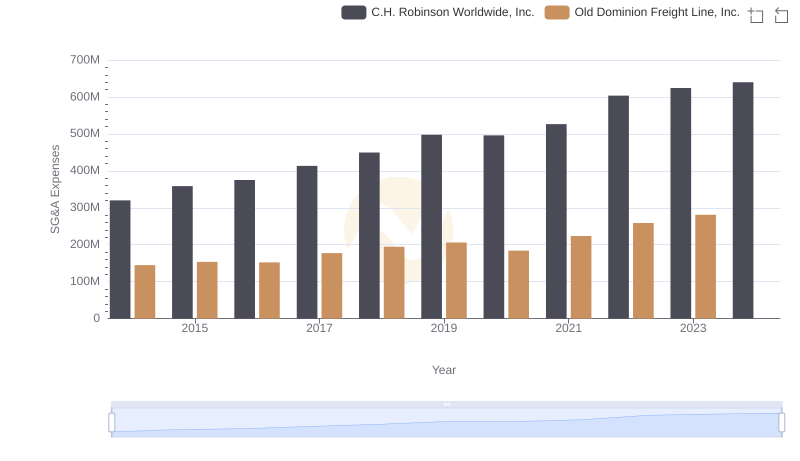
Comparing SG&A Expenses: Old Dominion Freight Line, Inc. vs C.H. Robinson Worldwide, Inc. Trends and Insights
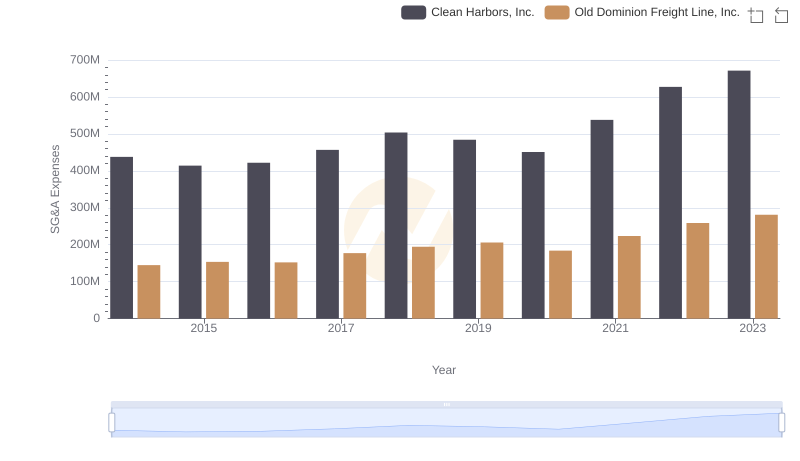
Selling, General, and Administrative Costs: Old Dominion Freight Line, Inc. vs Clean Harbors, Inc.
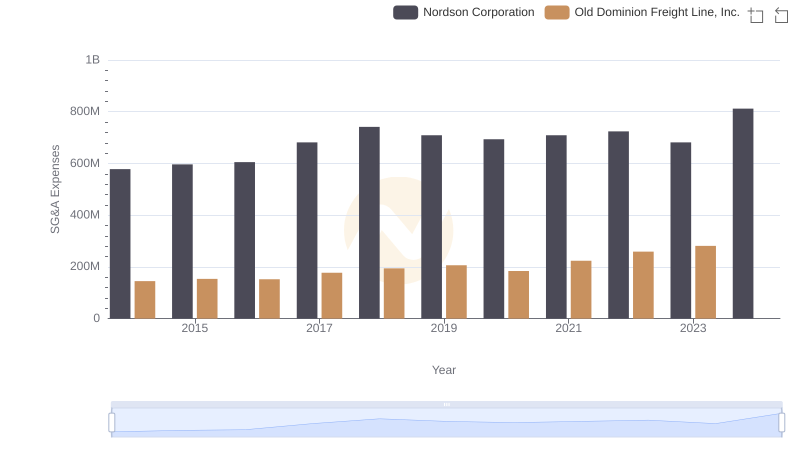
Breaking Down SG&A Expenses: Old Dominion Freight Line, Inc. vs Nordson Corporation
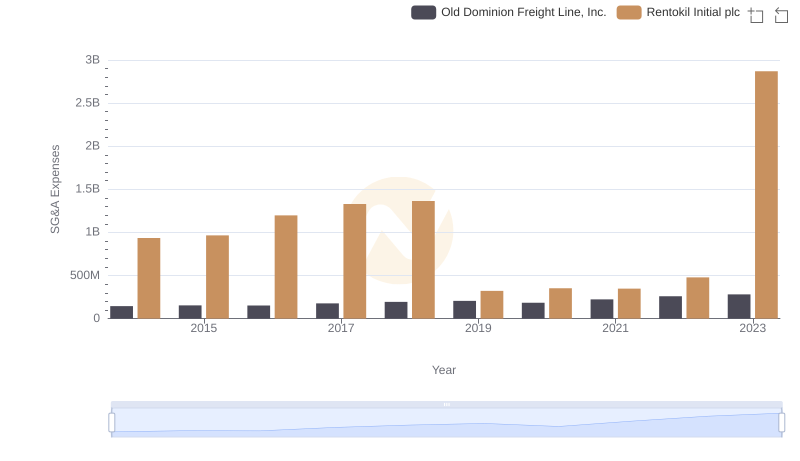
Old Dominion Freight Line, Inc. or Rentokil Initial plc: Who Manages SG&A Costs Better?
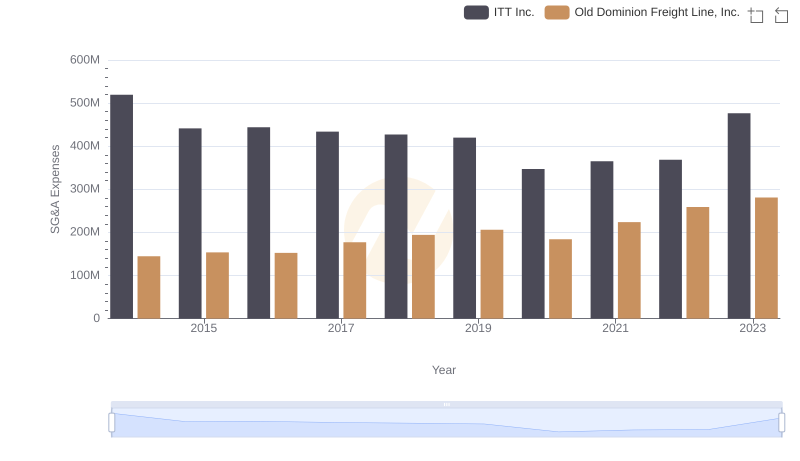
Old Dominion Freight Line, Inc. and ITT Inc.: SG&A Spending Patterns Compared