| __timestamp | Clean Harbors, Inc. | Old Dominion Freight Line, Inc. |
|---|---|---|
| Wednesday, January 1, 2014 | 3401636000 | 2787897000 |
| Thursday, January 1, 2015 | 3275137000 | 2972442000 |
| Friday, January 1, 2016 | 2755226000 | 2991517000 |
| Sunday, January 1, 2017 | 2944978000 | 3358112000 |
| Monday, January 1, 2018 | 3300303000 | 4043695000 |
| Tuesday, January 1, 2019 | 3412190000 | 4109111000 |
| Wednesday, January 1, 2020 | 3144097000 | 4015129000 |
| Friday, January 1, 2021 | 3805566000 | 5256328000 |
| Saturday, January 1, 2022 | 5166605000 | 6260077000 |
| Sunday, January 1, 2023 | 5409152000 | 5866152000 |
| Monday, January 1, 2024 | 5889952000 |
Unveiling the hidden dimensions of data
In the competitive landscape of freight and environmental services, Old Dominion Freight Line, Inc. and Clean Harbors, Inc. have showcased intriguing revenue trajectories over the past decade. From 2014 to 2023, Old Dominion Freight Line, Inc. has seen a robust growth of approximately 110%, with revenues peaking at $6.26 billion in 2022. This growth underscores their strategic expansion and operational efficiency. Meanwhile, Clean Harbors, Inc. experienced a steady climb, with a notable 60% increase in revenue, reaching $5.41 billion by 2023. This growth reflects their resilience and adaptability in the environmental services sector. The year 2022 marked a significant milestone for both companies, with Old Dominion achieving its highest revenue, while Clean Harbors continued its upward trajectory. These trends highlight the dynamic nature of these industries and the companies' ability to navigate economic challenges and capitalize on market opportunities.
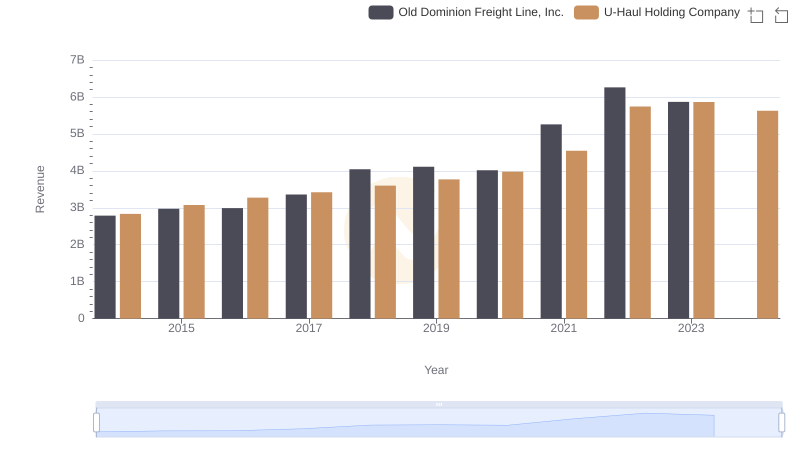
Old Dominion Freight Line, Inc. or U-Haul Holding Company: Who Leads in Yearly Revenue?
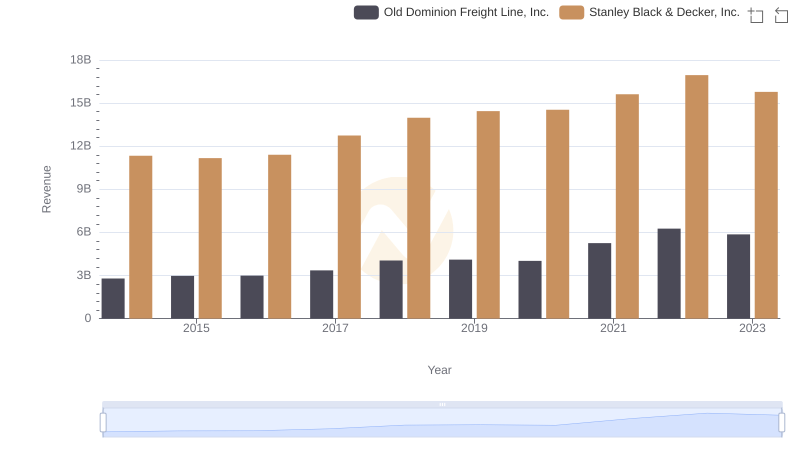
Old Dominion Freight Line, Inc. vs Stanley Black & Decker, Inc.: Annual Revenue Growth Compared
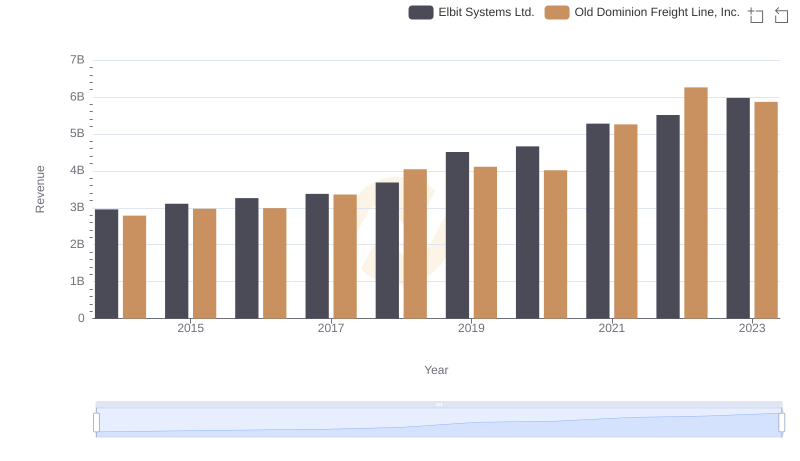
Old Dominion Freight Line, Inc. vs Elbit Systems Ltd.: Annual Revenue Growth Compared
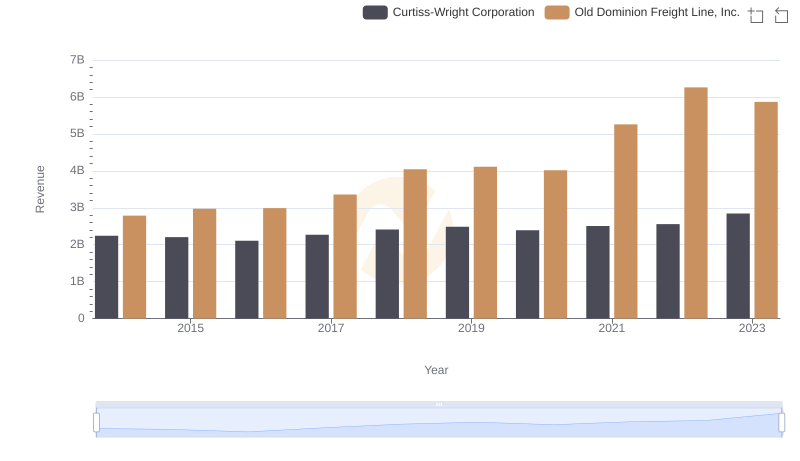
Annual Revenue Comparison: Old Dominion Freight Line, Inc. vs Curtiss-Wright Corporation
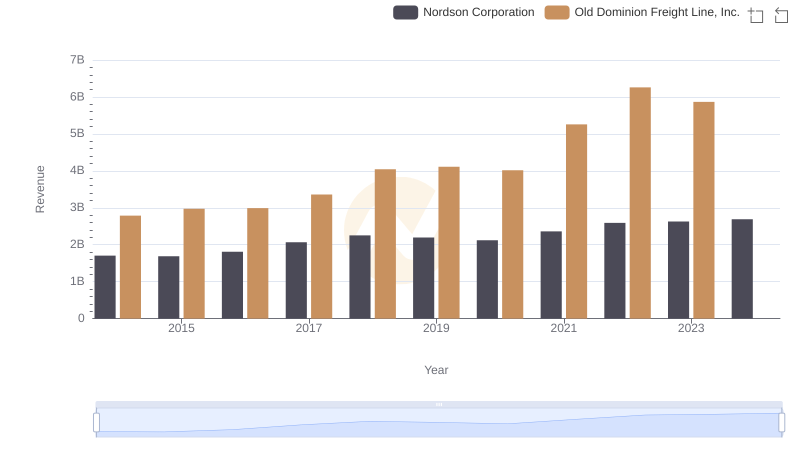
Old Dominion Freight Line, Inc. vs Nordson Corporation: Annual Revenue Growth Compared
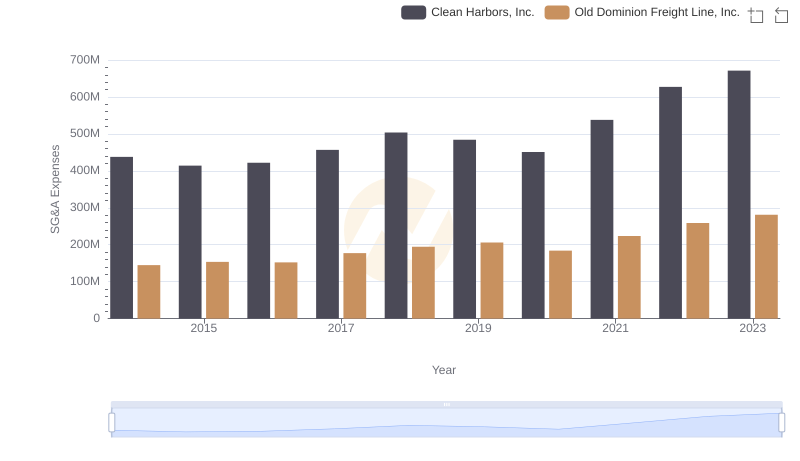
Selling, General, and Administrative Costs: Old Dominion Freight Line, Inc. vs Clean Harbors, Inc.
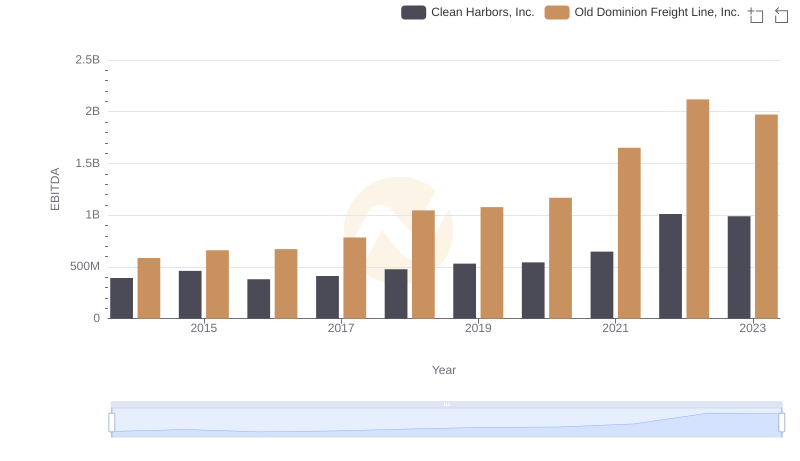
A Side-by-Side Analysis of EBITDA: Old Dominion Freight Line, Inc. and Clean Harbors, Inc.