| __timestamp | ITT Inc. | Old Dominion Freight Line, Inc. |
|---|---|---|
| Wednesday, January 1, 2014 | 519500000 | 144817000 |
| Thursday, January 1, 2015 | 441500000 | 153589000 |
| Friday, January 1, 2016 | 444100000 | 152391000 |
| Sunday, January 1, 2017 | 433700000 | 177205000 |
| Monday, January 1, 2018 | 427300000 | 194368000 |
| Tuesday, January 1, 2019 | 420000000 | 206125000 |
| Wednesday, January 1, 2020 | 347200000 | 184185000 |
| Friday, January 1, 2021 | 365100000 | 223757000 |
| Saturday, January 1, 2022 | 368500000 | 258883000 |
| Sunday, January 1, 2023 | 476600000 | 281053000 |
| Monday, January 1, 2024 | 502300000 |
Unlocking the unknown
In the world of corporate finance, understanding a company's spending patterns can reveal much about its strategic priorities. This analysis compares the Selling, General, and Administrative (SG&A) expenses of Old Dominion Freight Line, Inc. and ITT Inc. over the past decade.
From 2014 to 2023, ITT Inc. consistently allocated a higher percentage of its revenue to SG&A expenses compared to Old Dominion Freight Line, Inc. However, a notable trend emerges: while ITT Inc.'s SG&A expenses decreased by approximately 8% from 2014 to 2020, Old Dominion's increased by nearly 94% during the same period. This shift highlights Old Dominion's aggressive expansion and investment in operational efficiencies.
By 2023, Old Dominion's SG&A expenses surged to 54% of ITT's, up from just 28% in 2014. This growth trajectory underscores Old Dominion's commitment to scaling its operations, potentially positioning it for greater market share in the logistics sector.
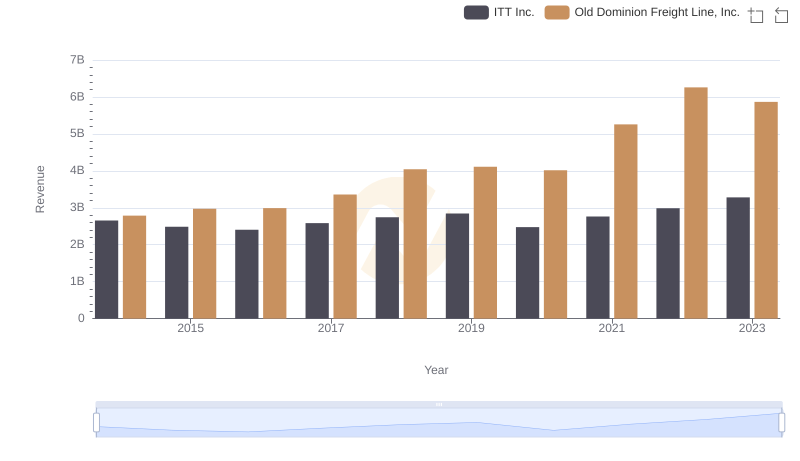
Annual Revenue Comparison: Old Dominion Freight Line, Inc. vs ITT Inc.
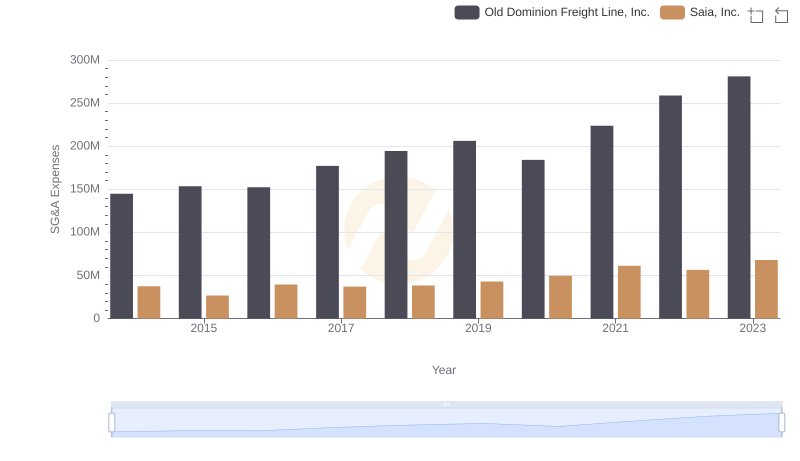
Breaking Down SG&A Expenses: Old Dominion Freight Line, Inc. vs Saia, Inc.
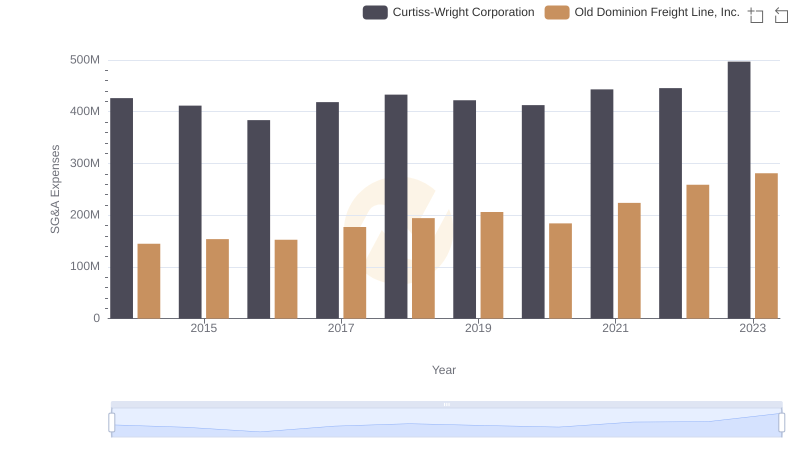
Cost Management Insights: SG&A Expenses for Old Dominion Freight Line, Inc. and Curtiss-Wright Corporation
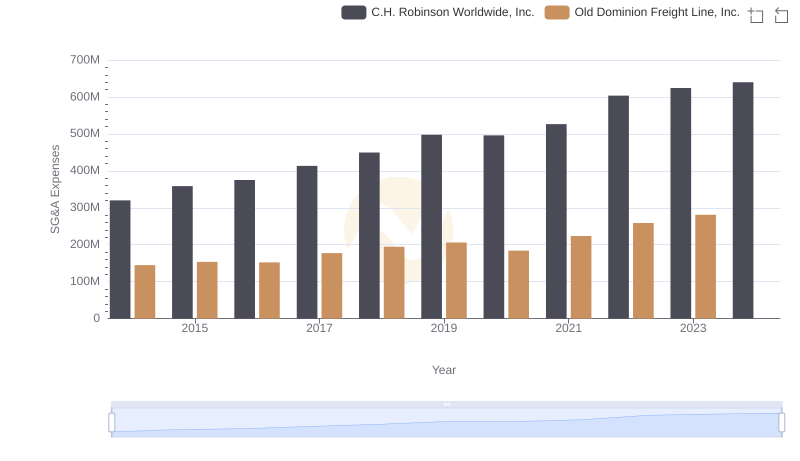
Comparing SG&A Expenses: Old Dominion Freight Line, Inc. vs C.H. Robinson Worldwide, Inc. Trends and Insights
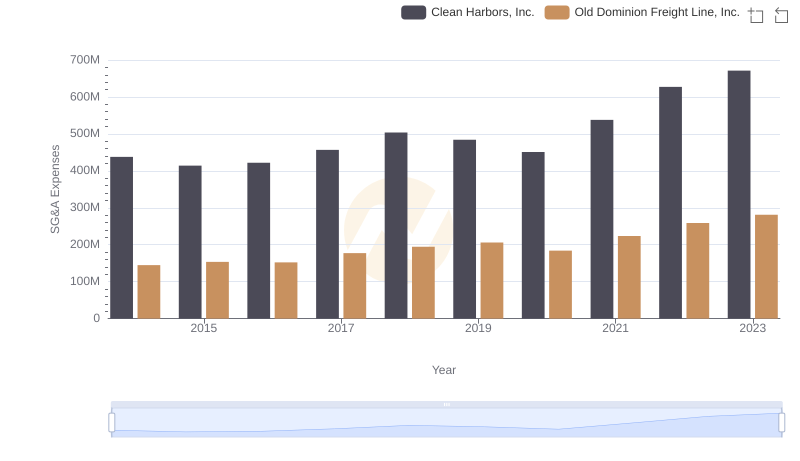
Selling, General, and Administrative Costs: Old Dominion Freight Line, Inc. vs Clean Harbors, Inc.
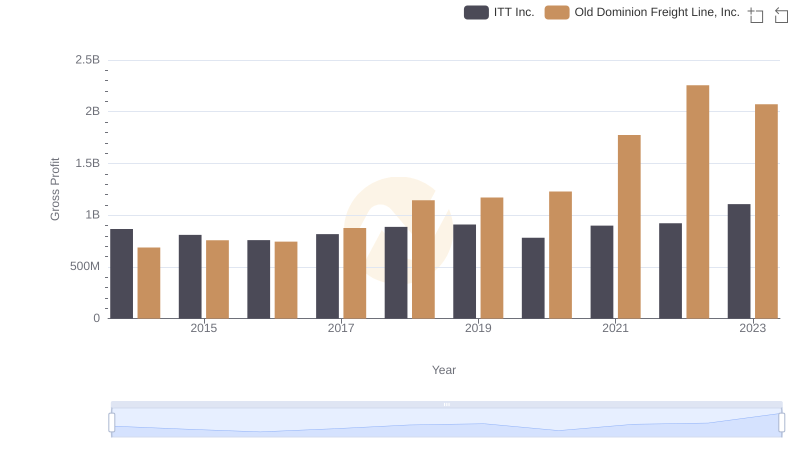
Gross Profit Comparison: Old Dominion Freight Line, Inc. and ITT Inc. Trends
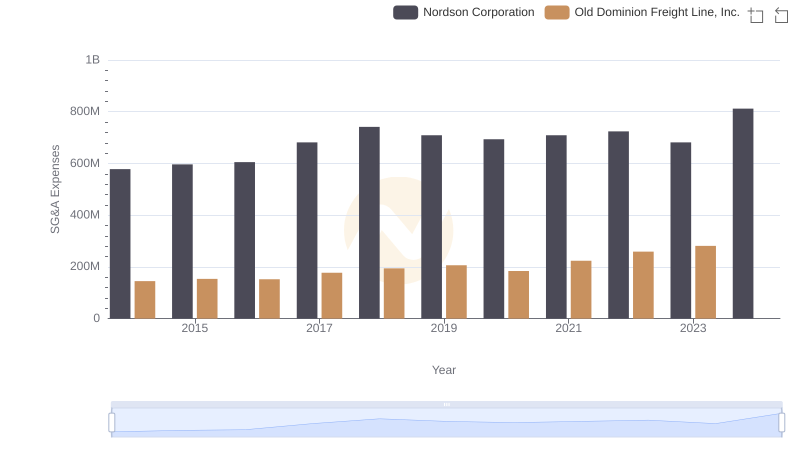
Breaking Down SG&A Expenses: Old Dominion Freight Line, Inc. vs Nordson Corporation
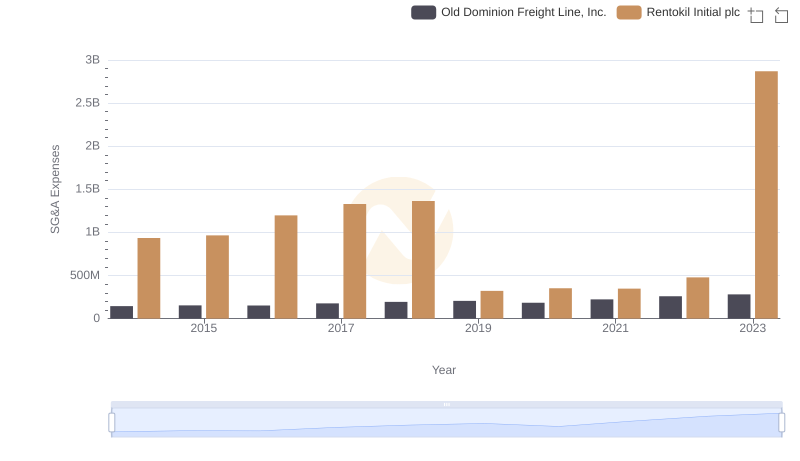
Old Dominion Freight Line, Inc. or Rentokil Initial plc: Who Manages SG&A Costs Better?
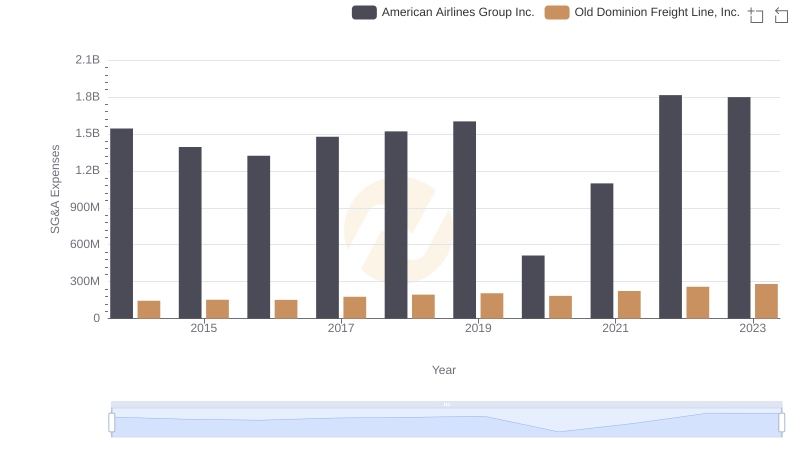
Old Dominion Freight Line, Inc. and American Airlines Group Inc.: SG&A Spending Patterns Compared
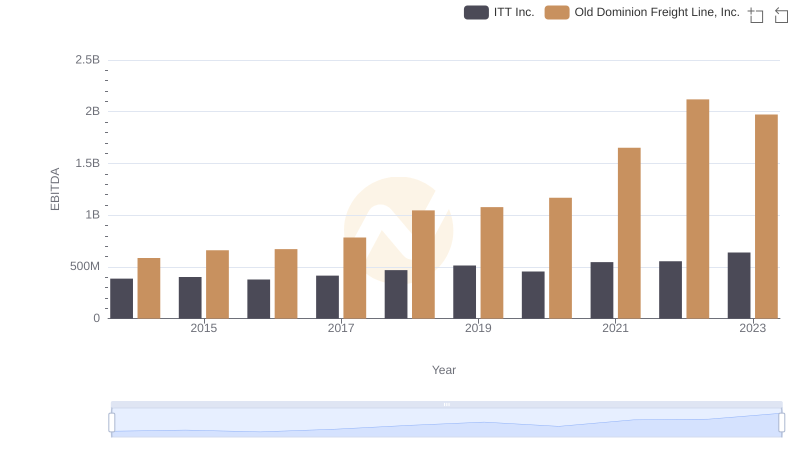
EBITDA Metrics Evaluated: Old Dominion Freight Line, Inc. vs ITT Inc.