| __timestamp | ITT Inc. | Old Dominion Freight Line, Inc. |
|---|---|---|
| Wednesday, January 1, 2014 | 866400000 | 687488000 |
| Thursday, January 1, 2015 | 809100000 | 757499000 |
| Friday, January 1, 2016 | 758200000 | 744627000 |
| Sunday, January 1, 2017 | 817200000 | 875380000 |
| Monday, January 1, 2018 | 887200000 | 1144243000 |
| Tuesday, January 1, 2019 | 910100000 | 1170216000 |
| Wednesday, January 1, 2020 | 782200000 | 1228598000 |
| Friday, January 1, 2021 | 899500000 | 1775060000 |
| Saturday, January 1, 2022 | 922300000 | 2256126000 |
| Sunday, January 1, 2023 | 1107300000 | 2072199000 |
| Monday, January 1, 2024 | 1247300000 |
Unleashing the power of data
In the ever-evolving landscape of American industry, Old Dominion Freight Line, Inc. and ITT Inc. have emerged as titans in their respective fields. Over the past decade, these companies have demonstrated remarkable growth in gross profit, with Old Dominion Freight Line, Inc. showing a staggering 200% increase from 2014 to 2023. Meanwhile, ITT Inc. has maintained a steady upward trajectory, achieving a 28% rise in the same period.
These trends underscore the dynamic nature of the U.S. economy and the resilience of these industry leaders.
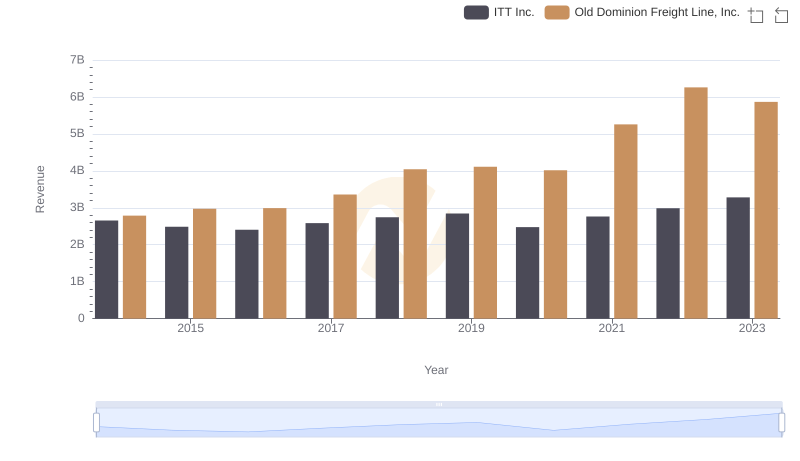
Annual Revenue Comparison: Old Dominion Freight Line, Inc. vs ITT Inc.
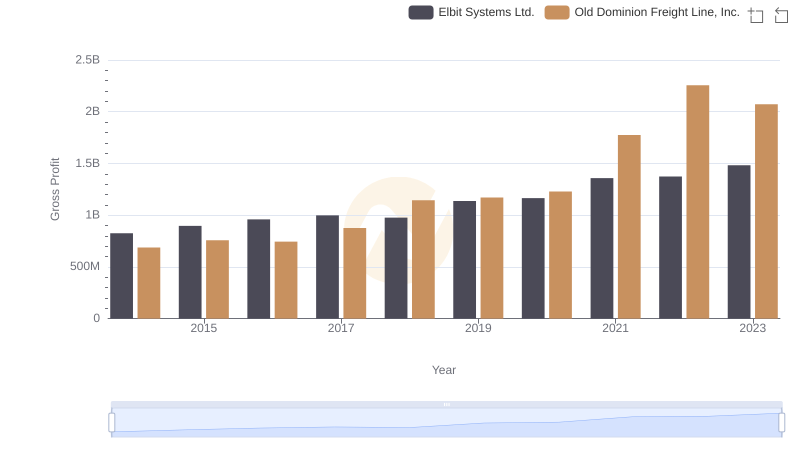
Gross Profit Trends Compared: Old Dominion Freight Line, Inc. vs Elbit Systems Ltd.
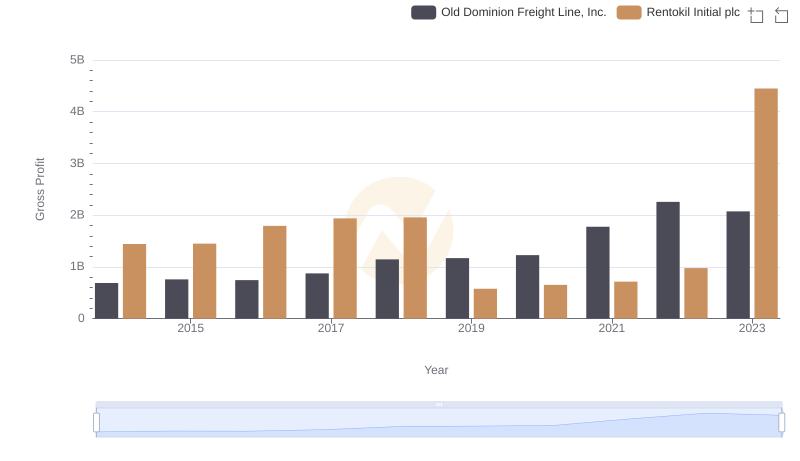
Gross Profit Comparison: Old Dominion Freight Line, Inc. and Rentokil Initial plc Trends
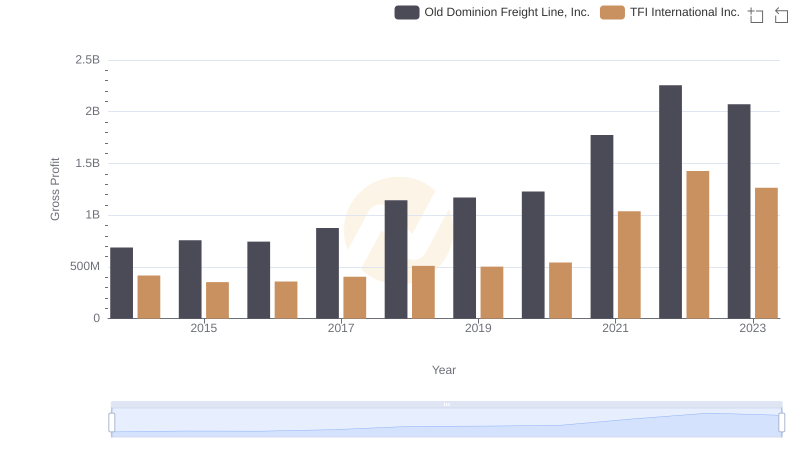
Gross Profit Analysis: Comparing Old Dominion Freight Line, Inc. and TFI International Inc.
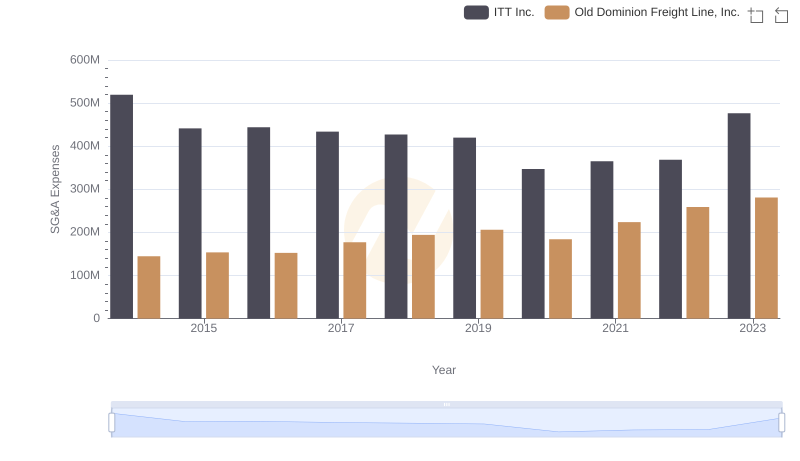
Old Dominion Freight Line, Inc. and ITT Inc.: SG&A Spending Patterns Compared
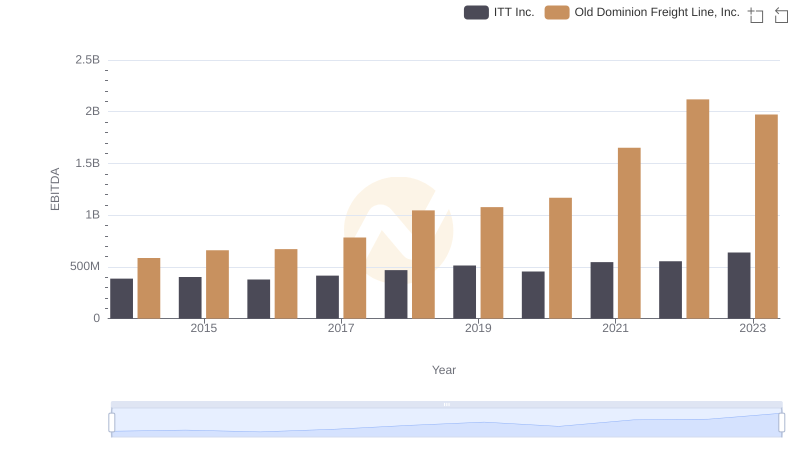
EBITDA Metrics Evaluated: Old Dominion Freight Line, Inc. vs ITT Inc.