| __timestamp | Motorola Solutions, Inc. | NetEase, Inc. |
|---|---|---|
| Wednesday, January 1, 2014 | 5881000000 | 11712834000 |
| Thursday, January 1, 2015 | 5695000000 | 22802895000 |
| Friday, January 1, 2016 | 6038000000 | 38178844000 |
| Sunday, January 1, 2017 | 6380000000 | 54102019000 |
| Monday, January 1, 2018 | 7343000000 | 67156453000 |
| Tuesday, January 1, 2019 | 7887000000 | 59241145000 |
| Wednesday, January 1, 2020 | 7414000000 | 73667133000 |
| Friday, January 1, 2021 | 8171000000 | 87606026000 |
| Saturday, January 1, 2022 | 9112000000 | 96495809000 |
| Sunday, January 1, 2023 | 9978000000 | 103468159000 |
| Monday, January 1, 2024 | 10817000000 |
Unleashing insights
In the ever-evolving landscape of global business, Motorola Solutions, Inc. and NetEase, Inc. stand as titans in their respective fields. Over the past decade, these companies have demonstrated remarkable revenue growth, albeit at different scales. From 2014 to 2023, Motorola Solutions saw its revenue grow by approximately 70%, reaching nearly $10 billion. Meanwhile, NetEase, a leader in the Chinese internet industry, experienced a staggering 780% increase, culminating in over $103 billion in revenue by 2023.
This comparison highlights the diverse growth trajectories of a technology solutions provider and an internet giant. While Motorola Solutions has steadily expanded its market presence, NetEase's explosive growth underscores the rapid digital transformation in China. As we look to the future, these trends offer valuable insights into the dynamics of global business and technology.
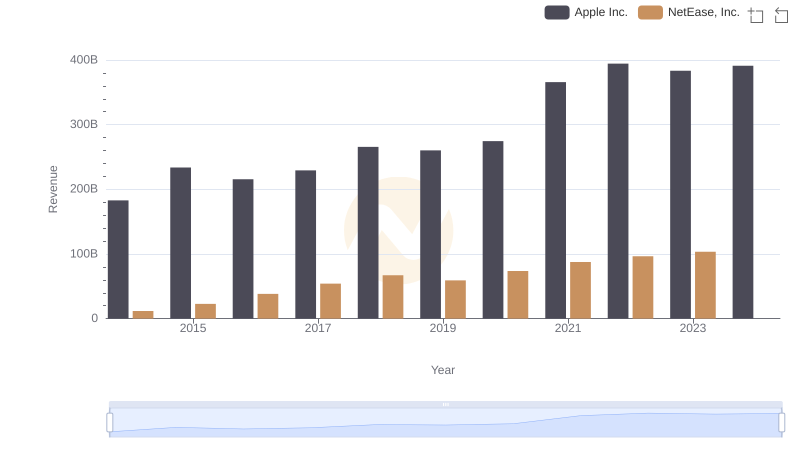
Revenue Insights: Apple Inc. and NetEase, Inc. Performance Compared
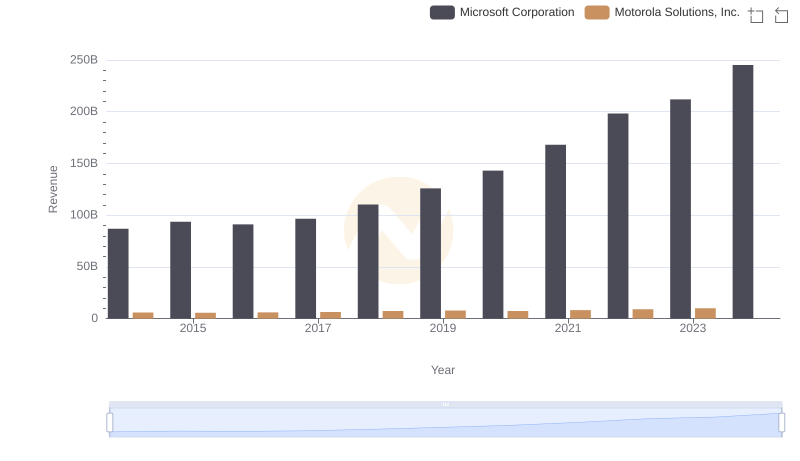
Annual Revenue Comparison: Microsoft Corporation vs Motorola Solutions, Inc.
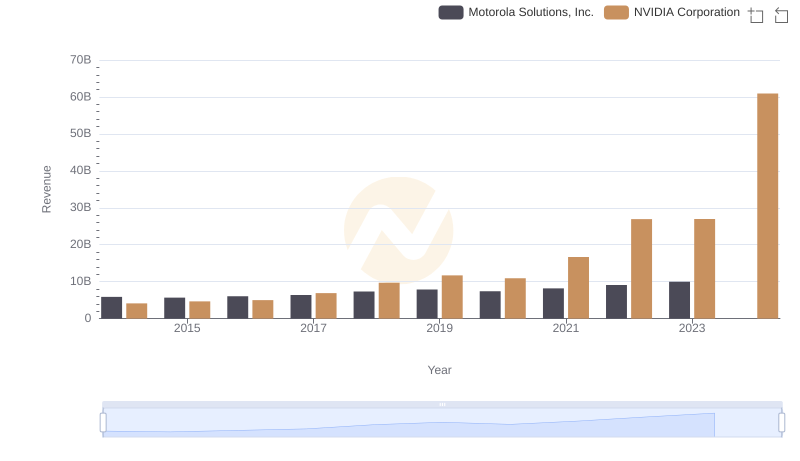
Comparing Revenue Performance: NVIDIA Corporation or Motorola Solutions, Inc.?
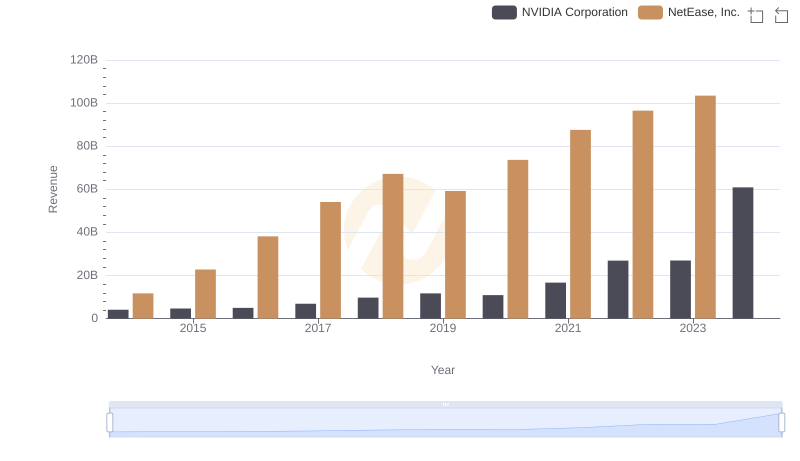
Revenue Insights: NVIDIA Corporation and NetEase, Inc. Performance Compared
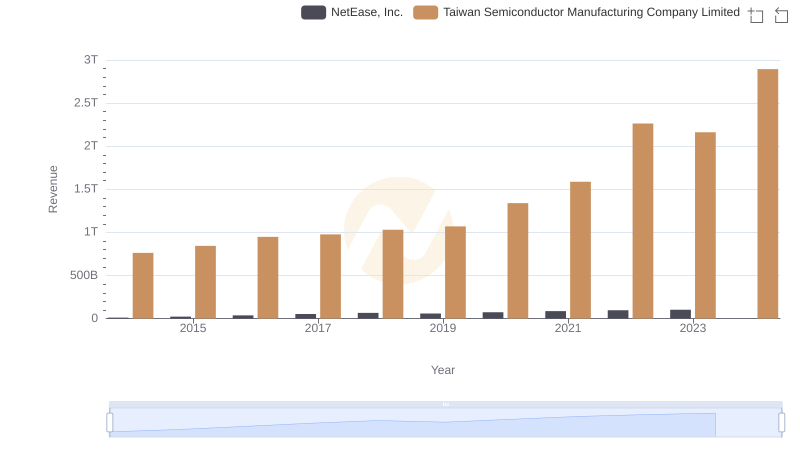
Revenue Showdown: Taiwan Semiconductor Manufacturing Company Limited vs NetEase, Inc.
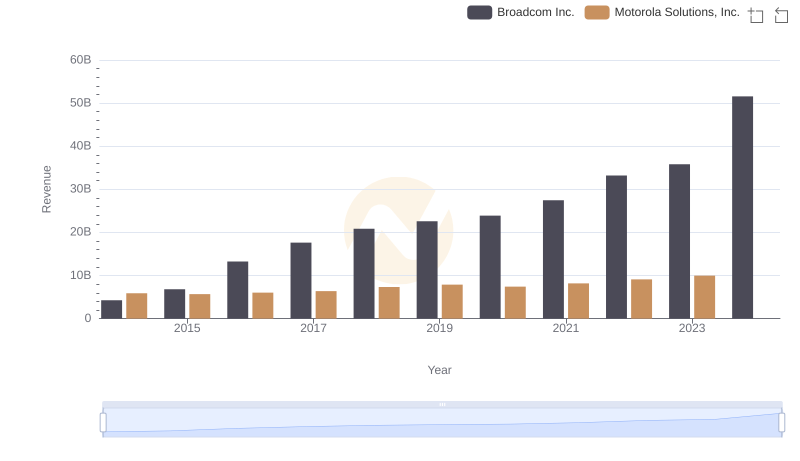
Comparing Revenue Performance: Broadcom Inc. or Motorola Solutions, Inc.?
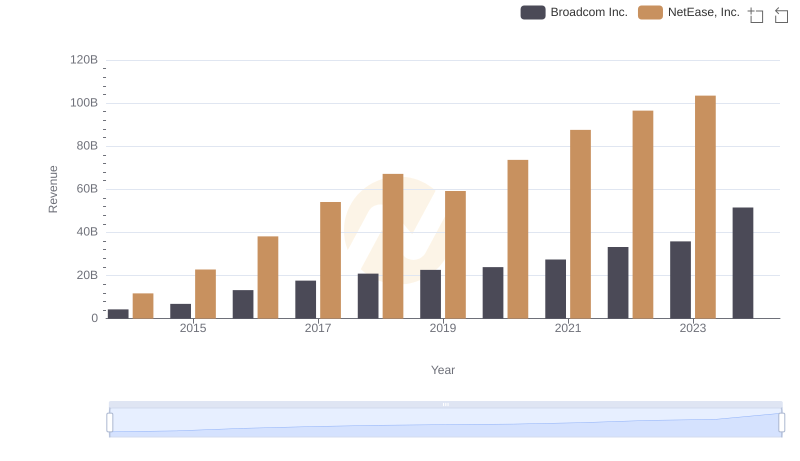
Breaking Down Revenue Trends: Broadcom Inc. vs NetEase, Inc.
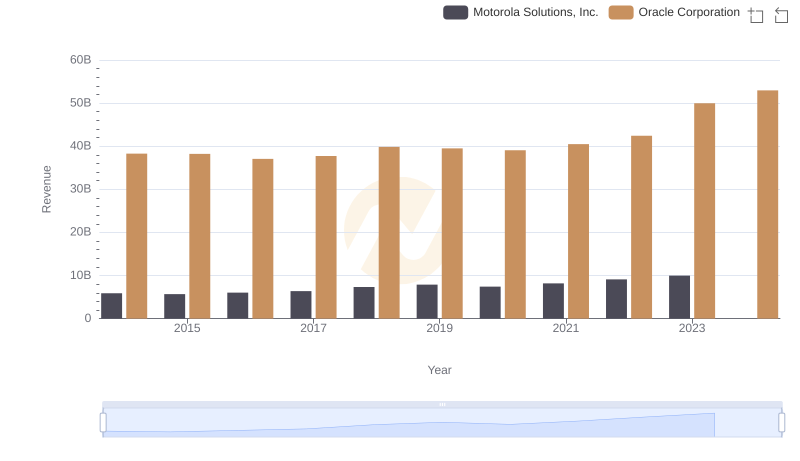
Revenue Showdown: Oracle Corporation vs Motorola Solutions, Inc.
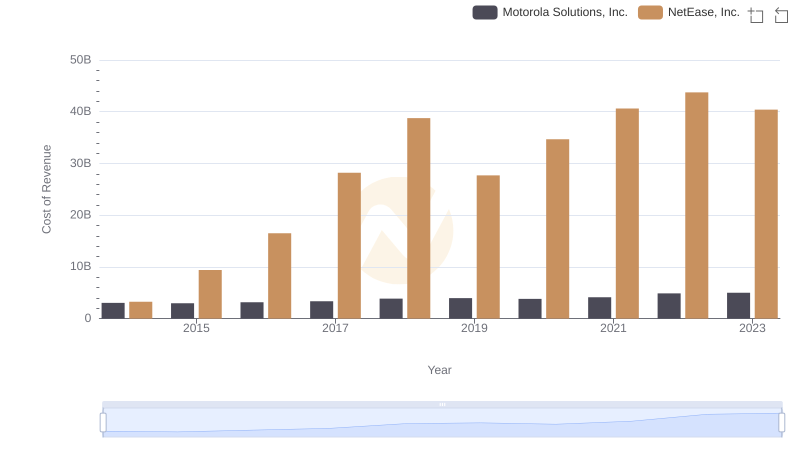
Cost of Revenue Trends: Motorola Solutions, Inc. vs NetEase, Inc.
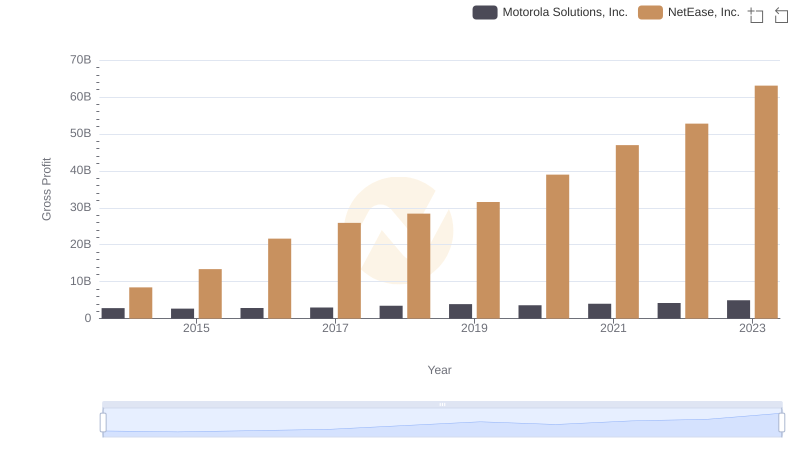
Gross Profit Analysis: Comparing Motorola Solutions, Inc. and NetEase, Inc.
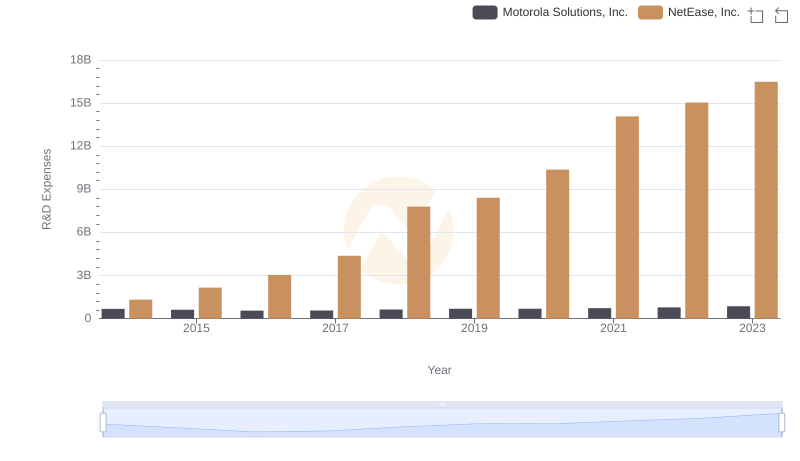
Research and Development Investment: Motorola Solutions, Inc. vs NetEase, Inc.
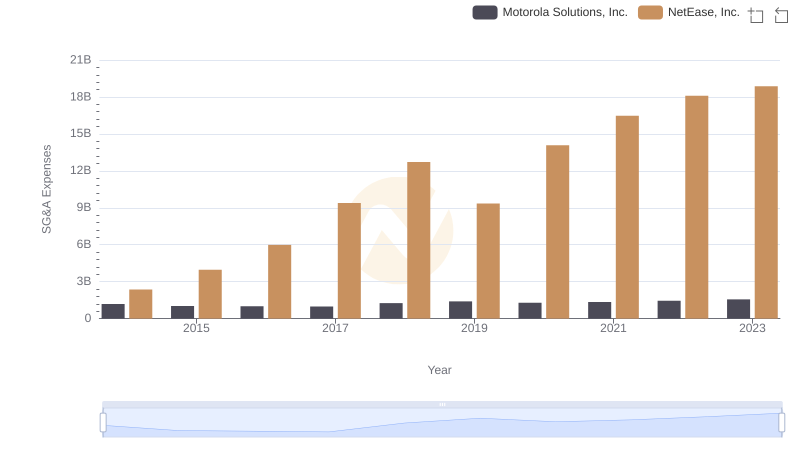
Cost Management Insights: SG&A Expenses for Motorola Solutions, Inc. and NetEase, Inc.