| __timestamp | Motorola Solutions, Inc. | NetEase, Inc. |
|---|---|---|
| Wednesday, January 1, 2014 | 2831000000 | 8451290000 |
| Thursday, January 1, 2015 | 2719000000 | 13403635000 |
| Friday, January 1, 2016 | 2869000000 | 21663812000 |
| Sunday, January 1, 2017 | 3024000000 | 25912693000 |
| Monday, January 1, 2018 | 3480000000 | 28403496000 |
| Tuesday, January 1, 2019 | 3931000000 | 31555300000 |
| Wednesday, January 1, 2020 | 3608000000 | 38983402000 |
| Friday, January 1, 2021 | 4040000000 | 46970801000 |
| Saturday, January 1, 2022 | 4229000000 | 52766126000 |
| Sunday, January 1, 2023 | 4970000000 | 63063394000 |
| Monday, January 1, 2024 | 5512000000 |
Data in motion
In the ever-evolving landscape of global business, understanding the financial health of companies is crucial. This analysis delves into the gross profit trends of two industry giants: Motorola Solutions, Inc. and NetEase, Inc., from 2014 to 2023. Over this period, NetEase, a leading internet technology company, has consistently outperformed Motorola Solutions, a key player in communications equipment, in terms of gross profit.
NetEase's gross profit surged by approximately 646% from 2014 to 2023, reflecting its robust growth in the digital economy. In contrast, Motorola Solutions experienced a more modest increase of around 76% during the same period. This stark difference highlights the dynamic nature of the tech industry and the varying growth trajectories of companies within it. As we move forward, these trends offer valuable insights into the strategic directions and market positions of these two influential corporations.
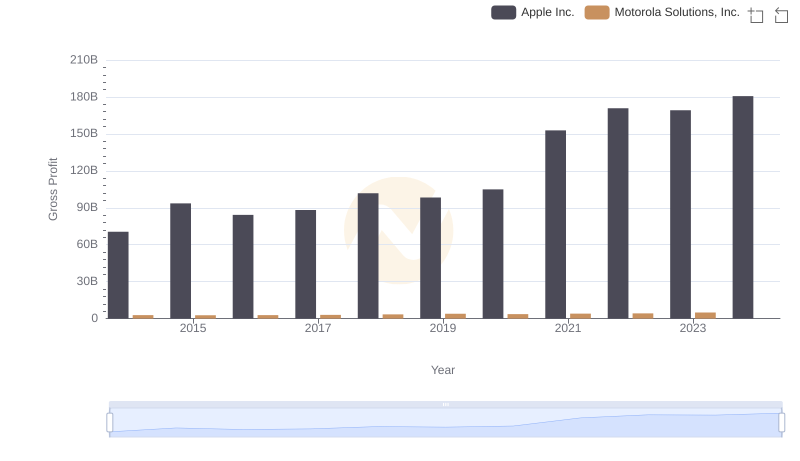
Gross Profit Trends Compared: Apple Inc. vs Motorola Solutions, Inc.
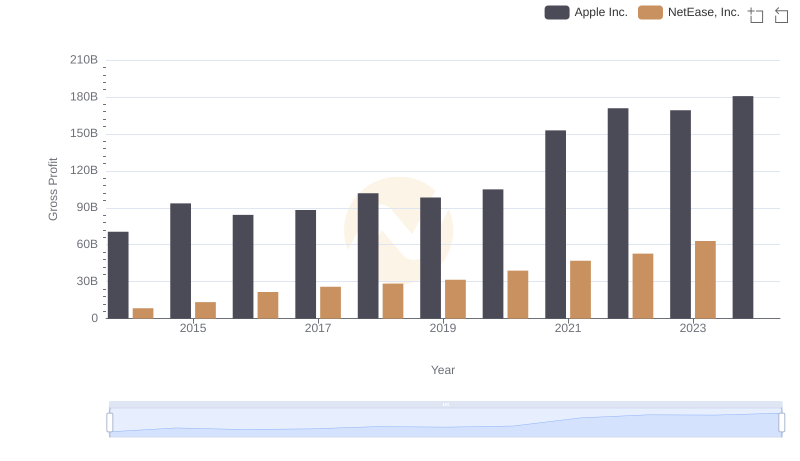
Gross Profit Analysis: Comparing Apple Inc. and NetEase, Inc.
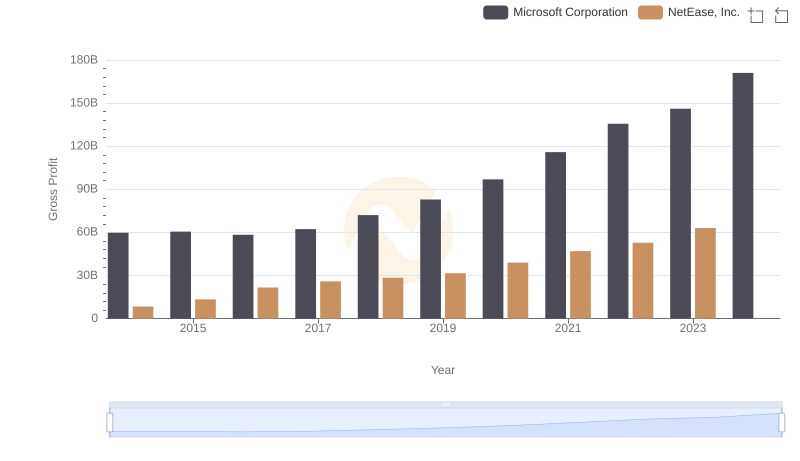
Who Generates Higher Gross Profit? Microsoft Corporation or NetEase, Inc.
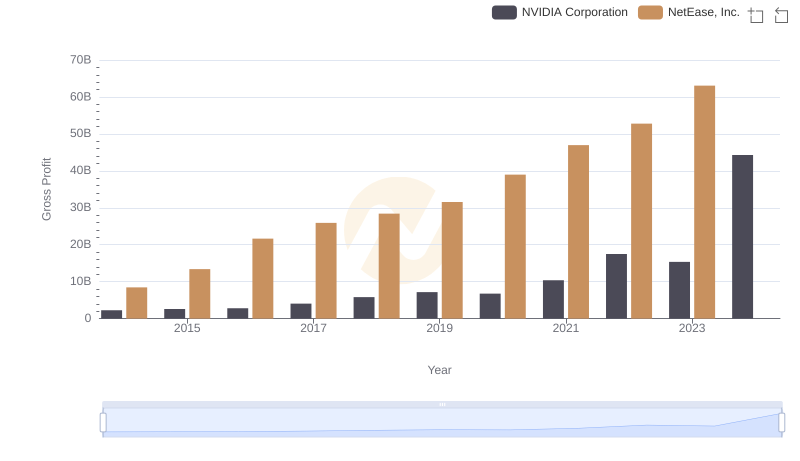
Who Generates Higher Gross Profit? NVIDIA Corporation or NetEase, Inc.
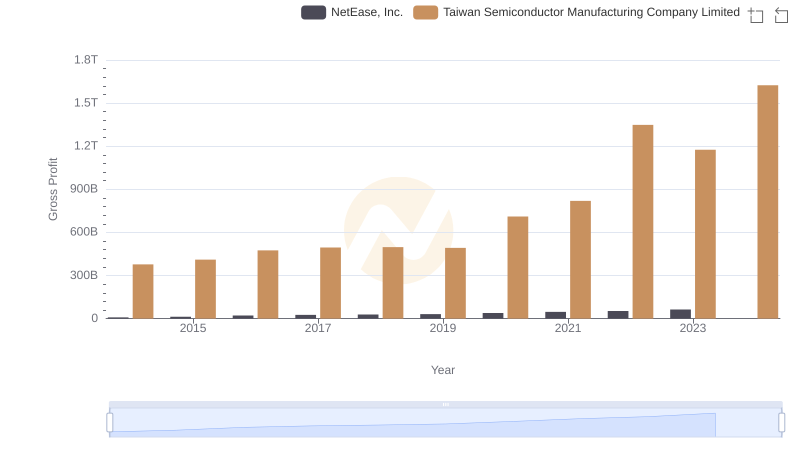
Who Generates Higher Gross Profit? Taiwan Semiconductor Manufacturing Company Limited or NetEase, Inc.
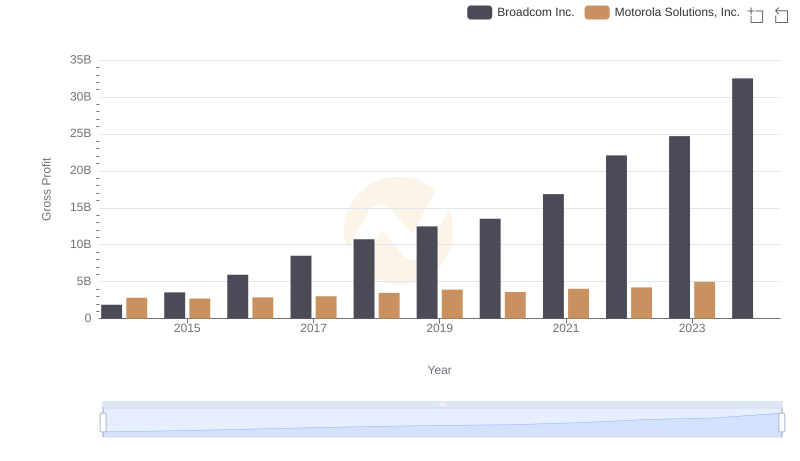
Key Insights on Gross Profit: Broadcom Inc. vs Motorola Solutions, Inc.
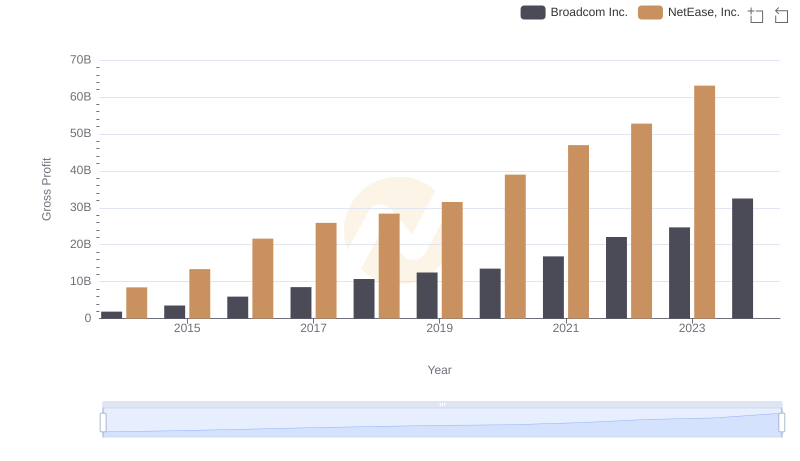
Key Insights on Gross Profit: Broadcom Inc. vs NetEase, Inc.
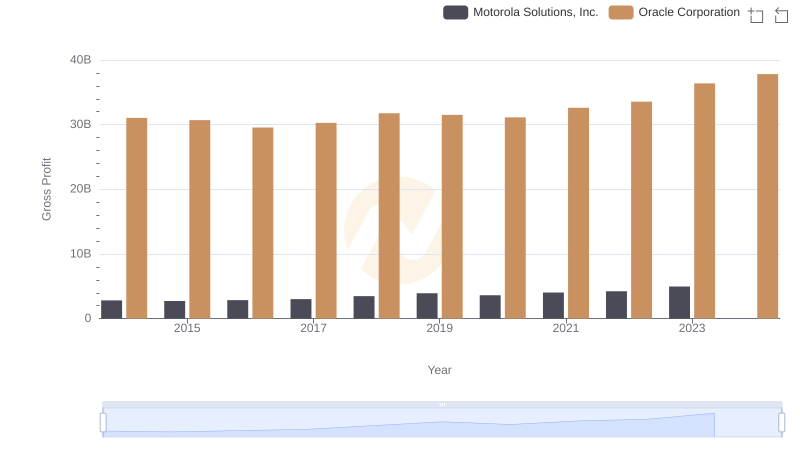
Oracle Corporation and Motorola Solutions, Inc.: A Detailed Gross Profit Analysis
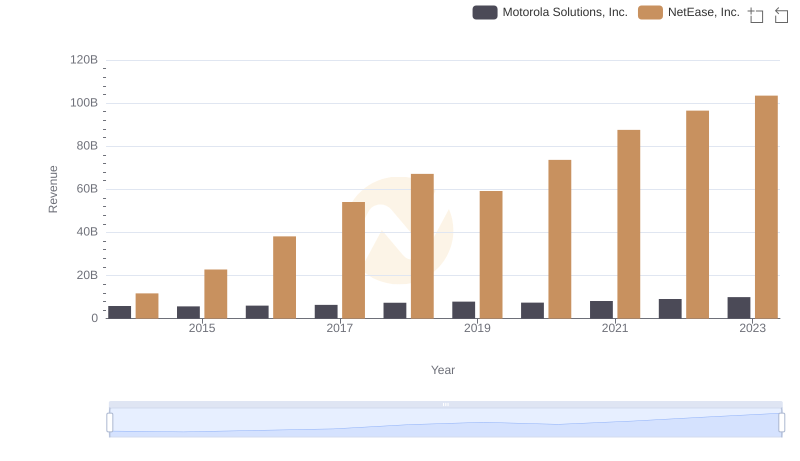
Motorola Solutions, Inc. vs NetEase, Inc.: Annual Revenue Growth Compared
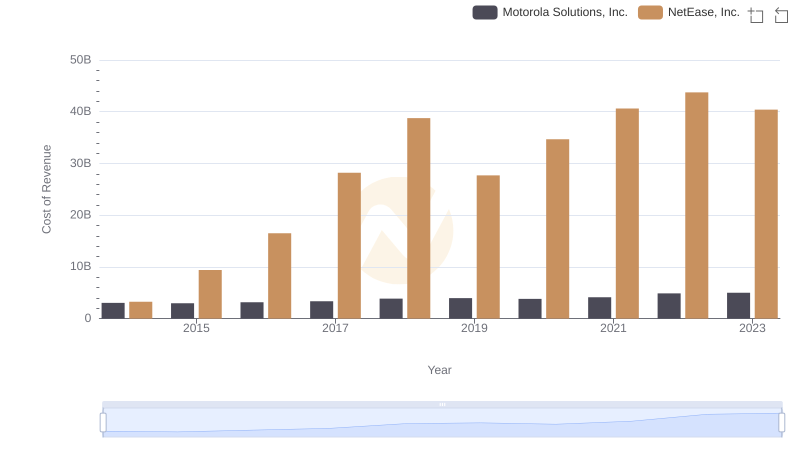
Cost of Revenue Trends: Motorola Solutions, Inc. vs NetEase, Inc.
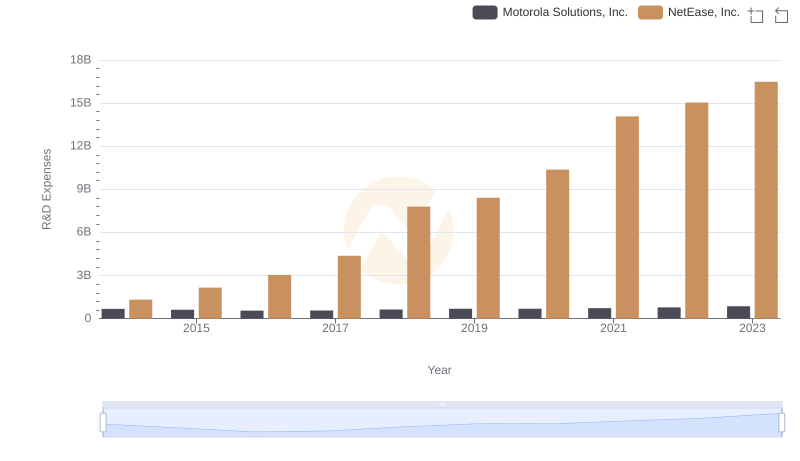
Research and Development Investment: Motorola Solutions, Inc. vs NetEase, Inc.
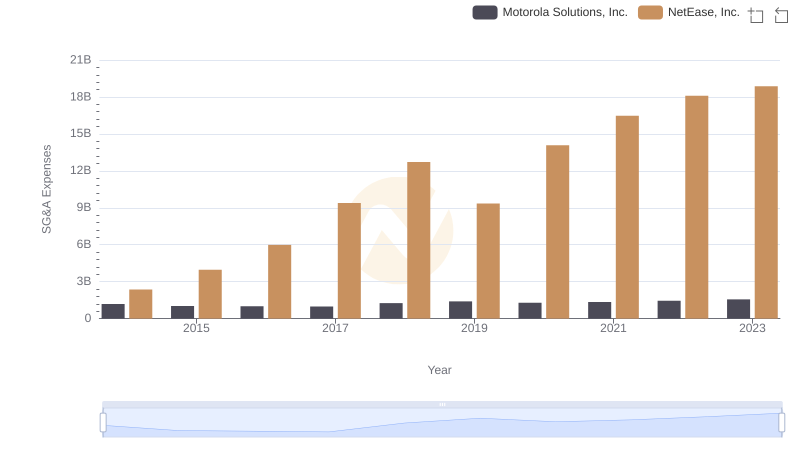
Cost Management Insights: SG&A Expenses for Motorola Solutions, Inc. and NetEase, Inc.