| __timestamp | Motorola Solutions, Inc. | NetEase, Inc. |
|---|---|---|
| Wednesday, January 1, 2014 | 3050000000 | 3261544000 |
| Thursday, January 1, 2015 | 2976000000 | 9399260000 |
| Friday, January 1, 2016 | 3169000000 | 16515032000 |
| Sunday, January 1, 2017 | 3356000000 | 28189326000 |
| Monday, January 1, 2018 | 3863000000 | 38752957000 |
| Tuesday, January 1, 2019 | 3956000000 | 27685845000 |
| Wednesday, January 1, 2020 | 3806000000 | 34683731000 |
| Friday, January 1, 2021 | 4131000000 | 40635225000 |
| Saturday, January 1, 2022 | 4883000000 | 43729683000 |
| Sunday, January 1, 2023 | 5008000000 | 40404765000 |
| Monday, January 1, 2024 | 5305000000 |
Unleashing the power of data
In the ever-evolving landscape of global technology, Motorola Solutions, Inc. and NetEase, Inc. have carved distinct paths. From 2014 to 2023, these industry titans have showcased contrasting cost of revenue trends. Motorola Solutions, a stalwart in communication solutions, saw a steady increase in its cost of revenue, peaking at approximately 5 billion USD in 2023, marking a 64% rise from 2014. Meanwhile, NetEase, a leader in online services, experienced a more volatile journey. Starting at 3.3 billion USD in 2014, its cost of revenue surged to over 40 billion USD by 2022, a staggering 1,200% increase, before slightly dipping in 2023. This divergence highlights the dynamic nature of their respective markets, with Motorola's consistent growth reflecting stability, while NetEase's fluctuations underscore the rapid expansion and challenges in the digital realm.
These trends offer valuable insights into how these companies manage their operational costs amidst changing market demands.
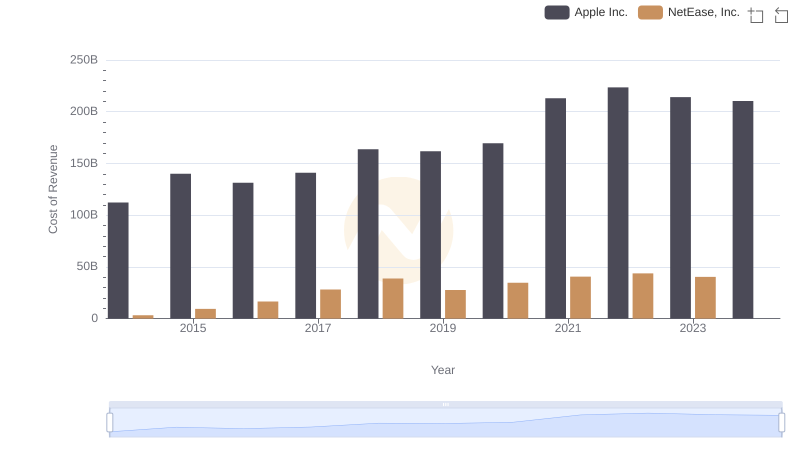
Cost of Revenue: Key Insights for Apple Inc. and NetEase, Inc.
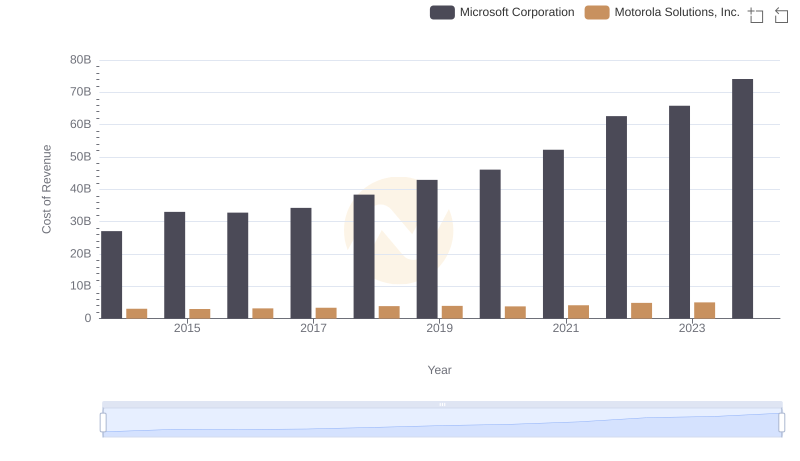
Cost Insights: Breaking Down Microsoft Corporation and Motorola Solutions, Inc.'s Expenses

Analyzing Cost of Revenue: NVIDIA Corporation and Motorola Solutions, Inc.
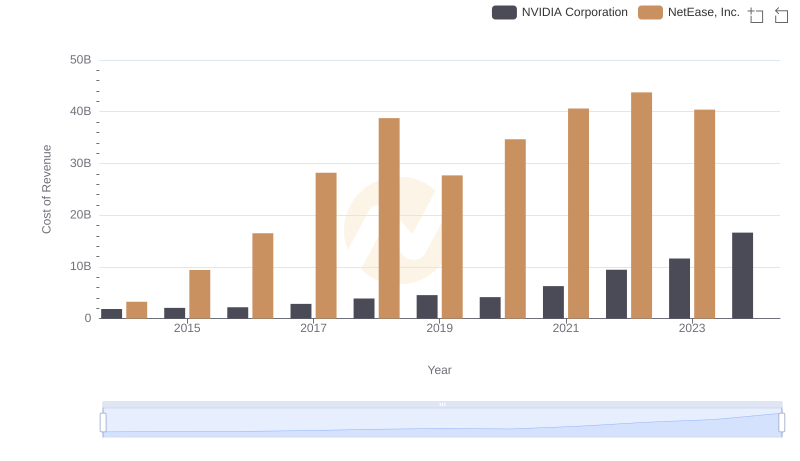
Comparing Cost of Revenue Efficiency: NVIDIA Corporation vs NetEase, Inc.
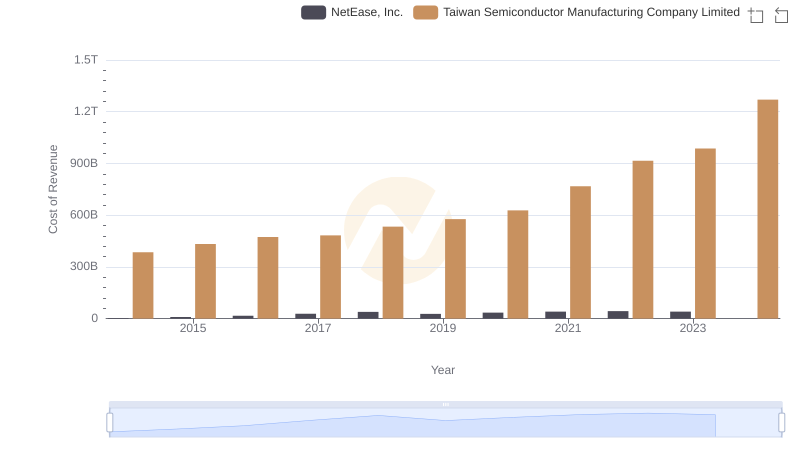
Taiwan Semiconductor Manufacturing Company Limited vs NetEase, Inc.: Efficiency in Cost of Revenue Explored
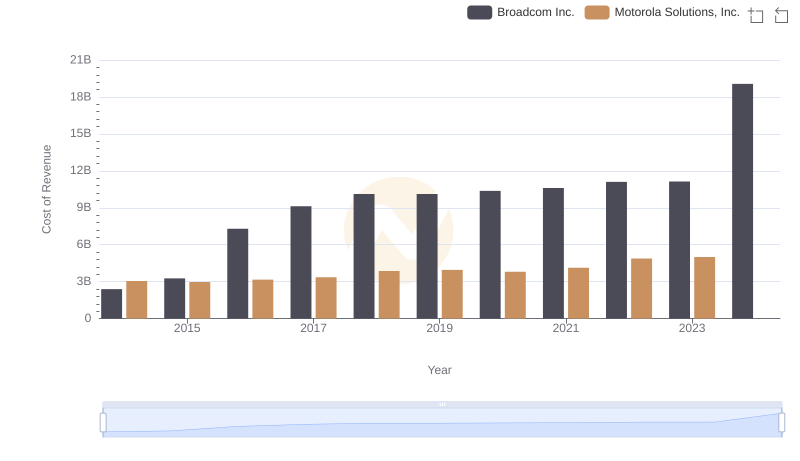
Comparing Cost of Revenue Efficiency: Broadcom Inc. vs Motorola Solutions, Inc.
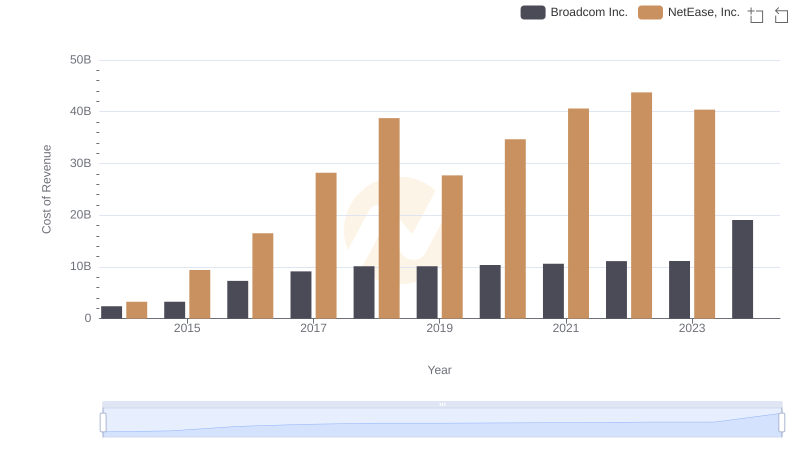
Cost of Revenue: Key Insights for Broadcom Inc. and NetEase, Inc.
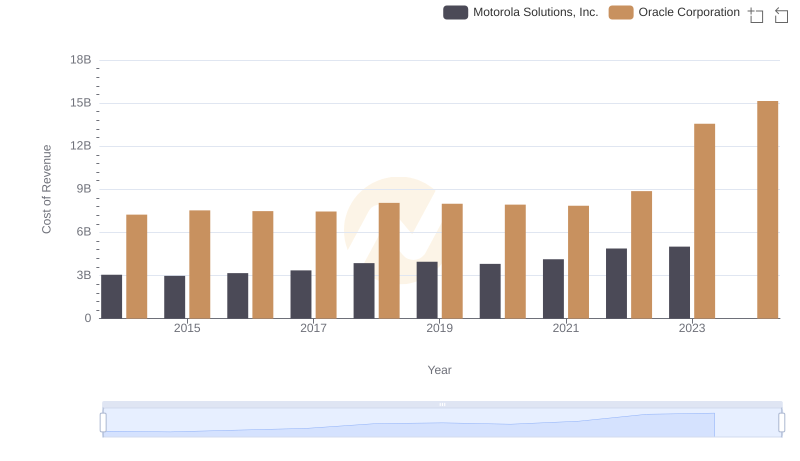
Analyzing Cost of Revenue: Oracle Corporation and Motorola Solutions, Inc.
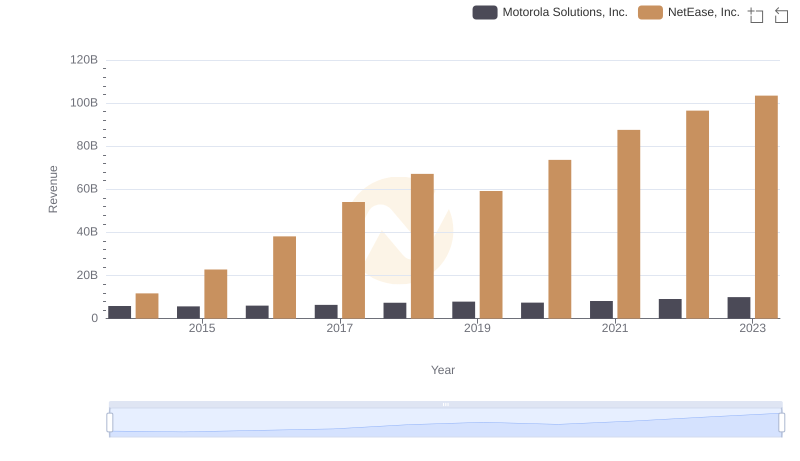
Motorola Solutions, Inc. vs NetEase, Inc.: Annual Revenue Growth Compared
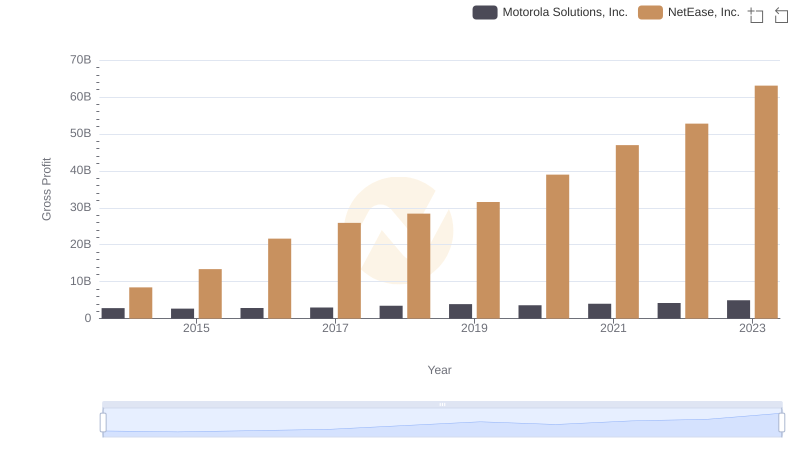
Gross Profit Analysis: Comparing Motorola Solutions, Inc. and NetEase, Inc.
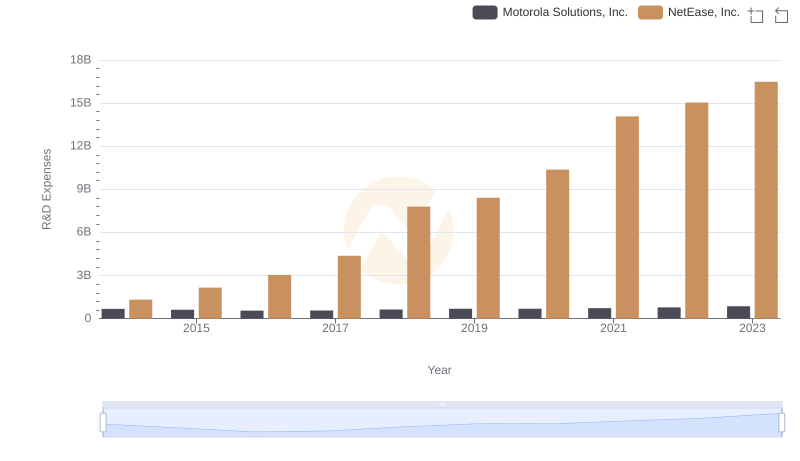
Research and Development Investment: Motorola Solutions, Inc. vs NetEase, Inc.
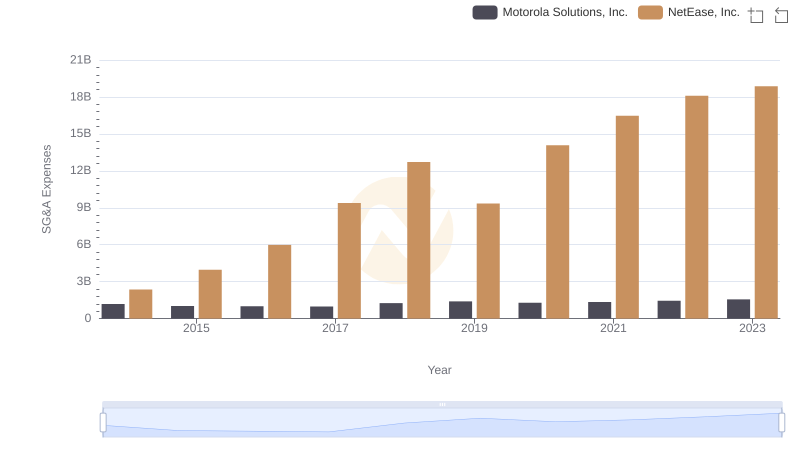
Cost Management Insights: SG&A Expenses for Motorola Solutions, Inc. and NetEase, Inc.