| __timestamp | IDEX Corporation | Union Pacific Corporation |
|---|---|---|
| Wednesday, January 1, 2014 | 949315000 | 9677000000 |
| Thursday, January 1, 2015 | 904315000 | 8976000000 |
| Friday, January 1, 2016 | 930767000 | 8269000000 |
| Sunday, January 1, 2017 | 1026678000 | 9009000000 |
| Monday, January 1, 2018 | 1117895000 | 9539000000 |
| Tuesday, January 1, 2019 | 1125034000 | 9614000000 |
| Wednesday, January 1, 2020 | 1027424000 | 9179000000 |
| Friday, January 1, 2021 | 1224500000 | 10514000000 |
| Saturday, January 1, 2022 | 1426900000 | 11205000000 |
| Sunday, January 1, 2023 | 1448500000 | 10529000000 |
| Monday, January 1, 2024 | 1454800000 | 11039000000 |
In pursuit of knowledge
Over the past decade, Union Pacific Corporation and IDEX Corporation have showcased intriguing trends in their gross profit margins. Union Pacific, a titan in the railroad industry, consistently outperformed IDEX, a leader in fluid and metering technologies, with gross profits averaging around 10 times higher. From 2014 to 2023, Union Pacific's gross profit grew by approximately 9%, peaking in 2022. Meanwhile, IDEX saw a remarkable 60% increase in the same period, highlighting its robust growth trajectory.
Union Pacific's gross profit reached its zenith in 2022, while IDEX's growth was more consistent, culminating in its highest profit in 2023. Notably, 2024 data for IDEX is missing, leaving room for speculation on its future performance. These trends underscore the dynamic nature of these industries and the potential for strategic growth.
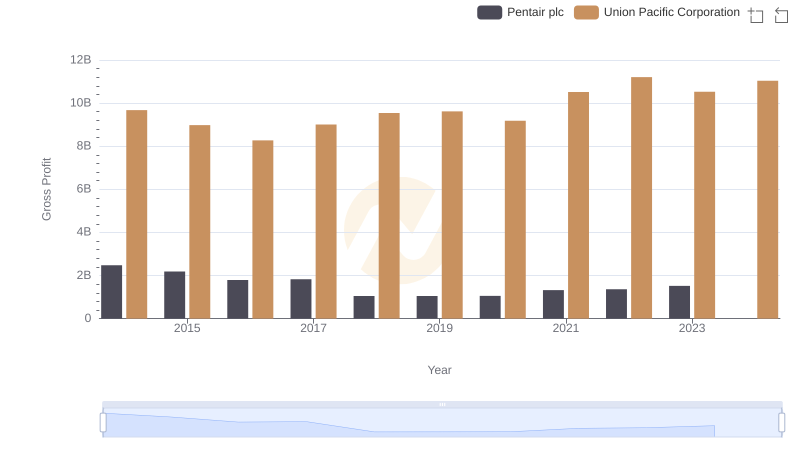
Key Insights on Gross Profit: Union Pacific Corporation vs Pentair plc
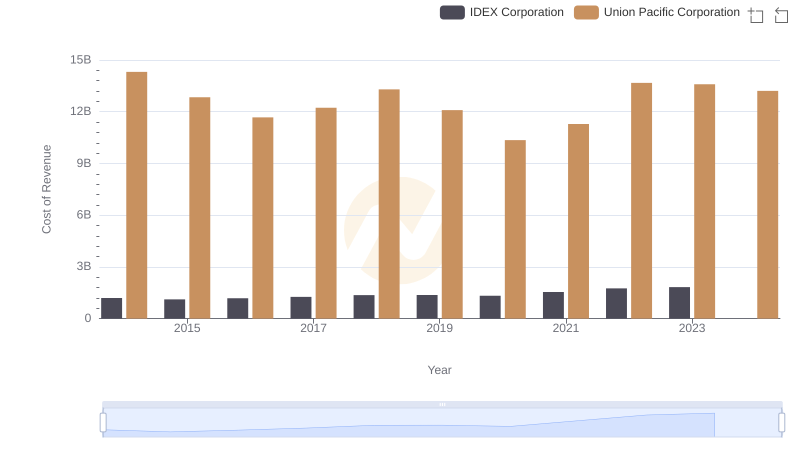
Cost of Revenue Comparison: Union Pacific Corporation vs IDEX Corporation
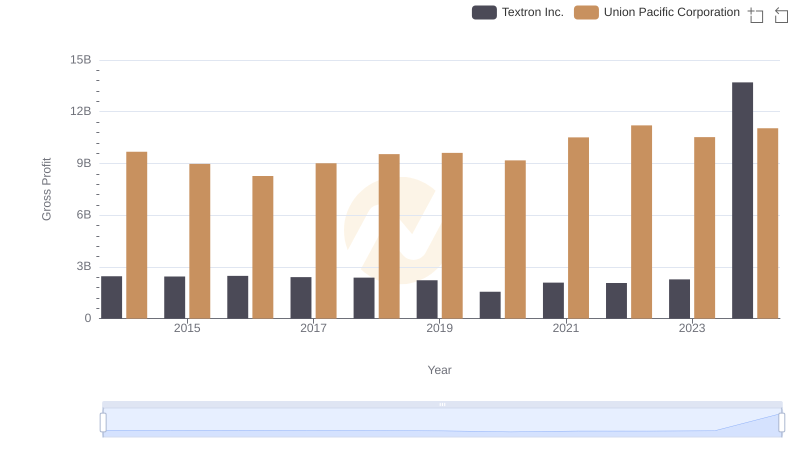
Union Pacific Corporation and Textron Inc.: A Detailed Gross Profit Analysis
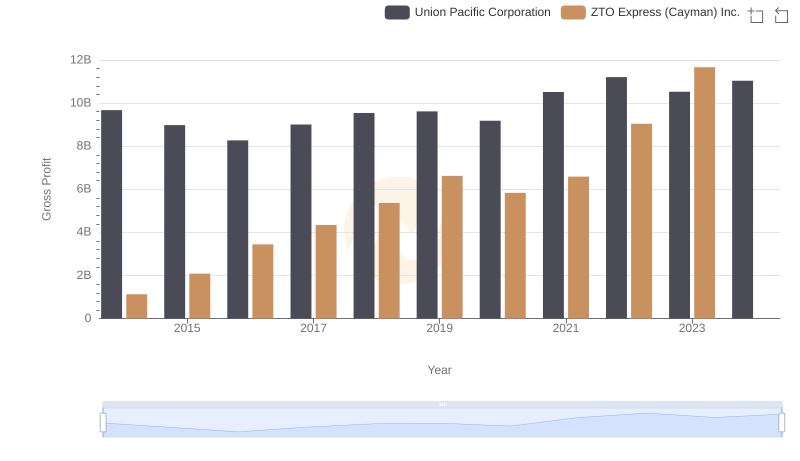
Who Generates Higher Gross Profit? Union Pacific Corporation or ZTO Express (Cayman) Inc.