| __timestamp | Ingersoll Rand Inc. | Textron Inc. |
|---|---|---|
| Wednesday, January 1, 2014 | 936781000 | 2457000000 |
| Thursday, January 1, 2015 | 779100000 | 2444000000 |
| Friday, January 1, 2016 | 716731000 | 2477000000 |
| Sunday, January 1, 2017 | 897900000 | 2403000000 |
| Monday, January 1, 2018 | 1012500000 | 2378000000 |
| Tuesday, January 1, 2019 | 911700000 | 2224000000 |
| Wednesday, January 1, 2020 | 1613400000 | 1557000000 |
| Friday, January 1, 2021 | 1988500000 | 2085000000 |
| Saturday, January 1, 2022 | 2325600000 | 2069000000 |
| Sunday, January 1, 2023 | 2882200000 | 2278000000 |
| Monday, January 1, 2024 | 0 | 2502000000 |
Infusing magic into the data realm
In the competitive landscape of industrial manufacturing, understanding financial performance is crucial. This analysis delves into the gross profit trends of Ingersoll Rand Inc. and Textron Inc. from 2014 to 2023. Over this decade, Ingersoll Rand Inc. has shown a remarkable growth trajectory, with its gross profit increasing by approximately 207%, peaking at $2.88 billion in 2023. In contrast, Textron Inc. experienced a more modest growth, with a notable spike in 2024, reaching an impressive $13.7 billion, although data for Ingersoll Rand in 2024 is unavailable.
The year 2020 marked a pivotal point for both companies, with Ingersoll Rand's gross profit surging by 77% compared to the previous year, while Textron faced a dip. This divergence highlights the resilience and strategic maneuvers of Ingersoll Rand during challenging times. As we look forward, these trends offer valuable insights into the financial health and strategic direction of these industrial giants.
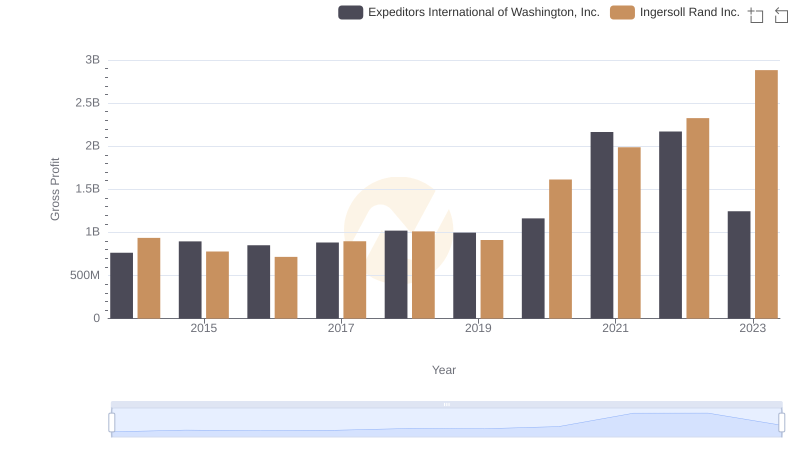
Who Generates Higher Gross Profit? Ingersoll Rand Inc. or Expeditors International of Washington, Inc.
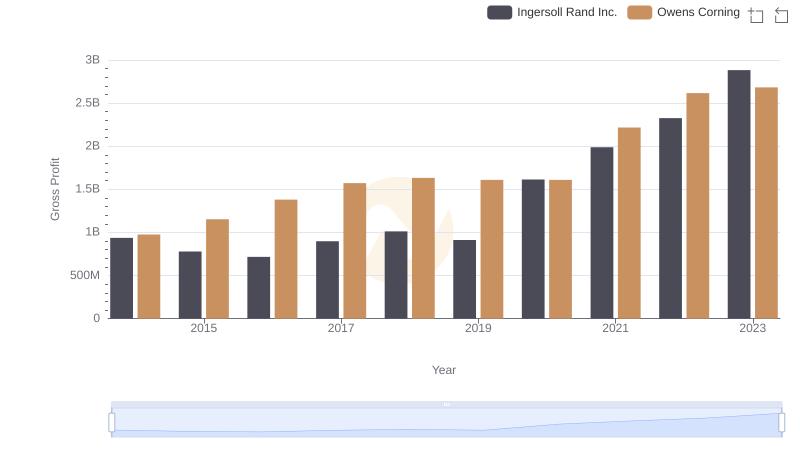
Who Generates Higher Gross Profit? Ingersoll Rand Inc. or Owens Corning
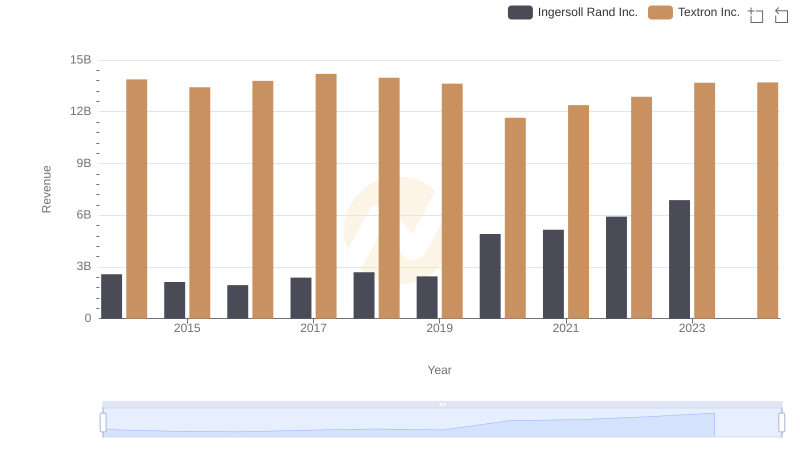
Breaking Down Revenue Trends: Ingersoll Rand Inc. vs Textron Inc.
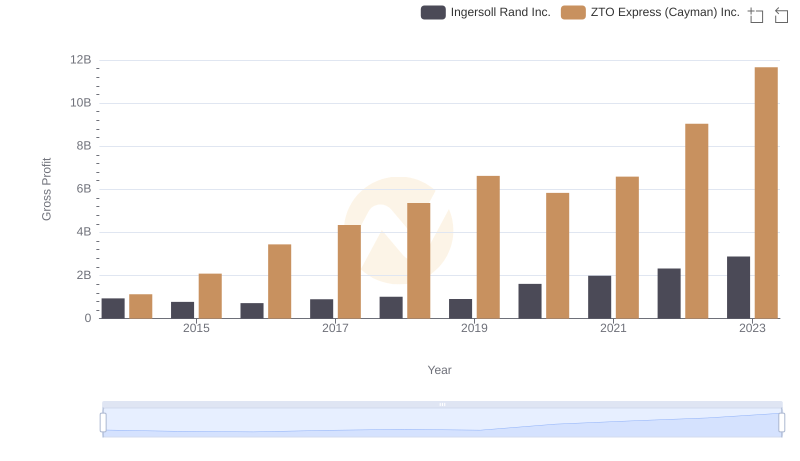
Gross Profit Comparison: Ingersoll Rand Inc. and ZTO Express (Cayman) Inc. Trends
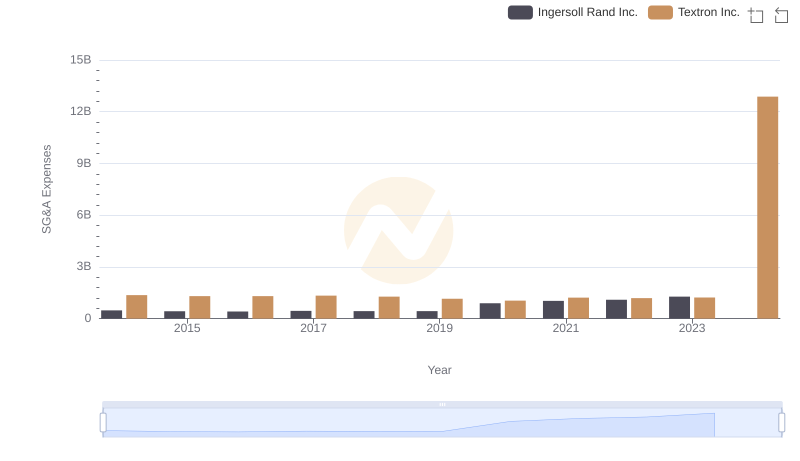
Ingersoll Rand Inc. or Textron Inc.: Who Manages SG&A Costs Better?
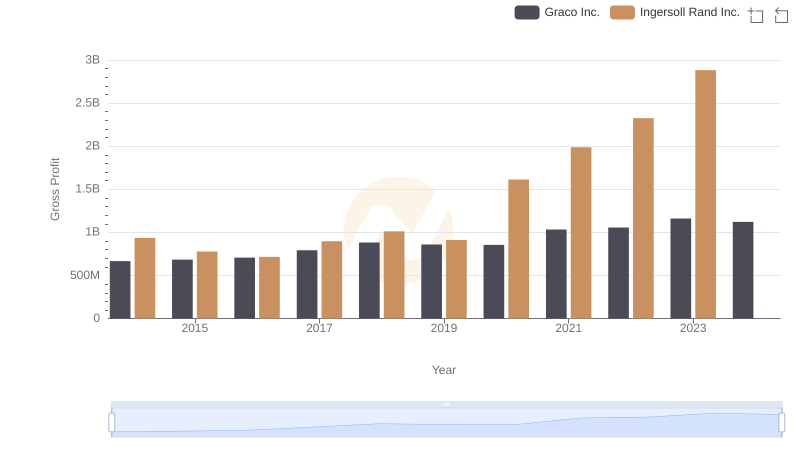
Gross Profit Trends Compared: Ingersoll Rand Inc. vs Graco Inc.
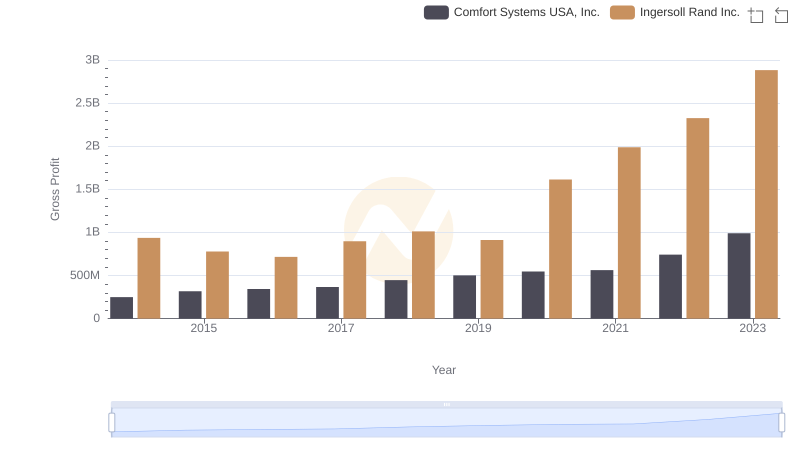
Key Insights on Gross Profit: Ingersoll Rand Inc. vs Comfort Systems USA, Inc.