| __timestamp | Builders FirstSource, Inc. | CSX Corporation |
|---|---|---|
| Wednesday, January 1, 2014 | 356997000 | 3613000000 |
| Thursday, January 1, 2015 | 901458000 | 3584000000 |
| Friday, January 1, 2016 | 1596748000 | 3389000000 |
| Sunday, January 1, 2017 | 1727391000 | 3773000000 |
| Monday, January 1, 2018 | 1922940000 | 4773000000 |
| Tuesday, January 1, 2019 | 1976829000 | 4874000000 |
| Wednesday, January 1, 2020 | 2222584000 | 4362000000 |
| Friday, January 1, 2021 | 5850956000 | 5140000000 |
| Saturday, January 1, 2022 | 7744379000 | 5785000000 |
| Sunday, January 1, 2023 | 6012334000 | 5527000000 |
In pursuit of knowledge
In the ever-evolving landscape of American industry, CSX Corporation and Builders FirstSource, Inc. stand as titans in their respective fields. Over the past decade, these companies have showcased remarkable growth in gross profit, reflecting their strategic prowess and market adaptability.
From 2014 to 2023, Builders FirstSource, Inc. experienced a staggering increase in gross profit, growing by over 1,500%. This surge is a testament to their robust expansion strategies and the booming demand in the construction sector. Meanwhile, CSX Corporation, a leader in the transportation industry, demonstrated steady growth, with a 53% increase in gross profit over the same period.
The data reveals a fascinating narrative of resilience and growth, highlighting how these companies have navigated economic challenges and capitalized on opportunities. As we look to the future, these trends offer valuable insights into the dynamics of American industry.
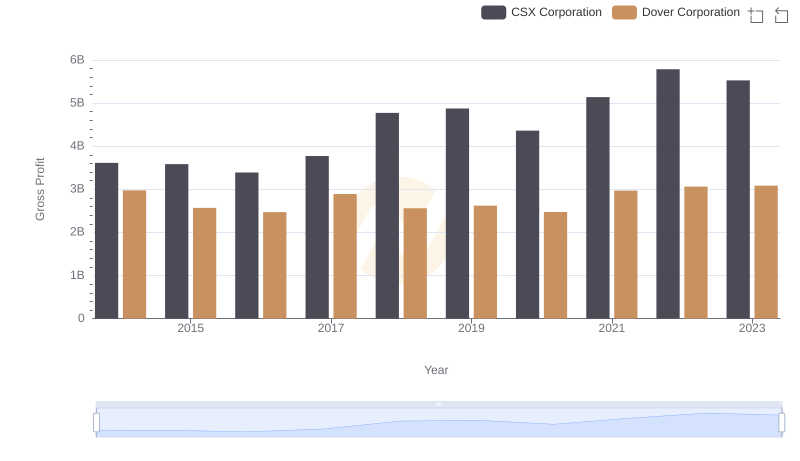
Key Insights on Gross Profit: CSX Corporation vs Dover Corporation

CSX Corporation and Lennox International Inc.: A Detailed Gross Profit Analysis
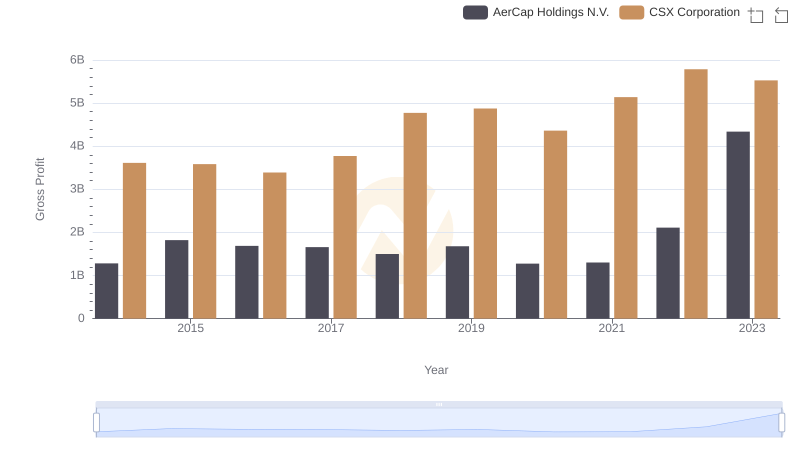
CSX Corporation and AerCap Holdings N.V.: A Detailed Gross Profit Analysis
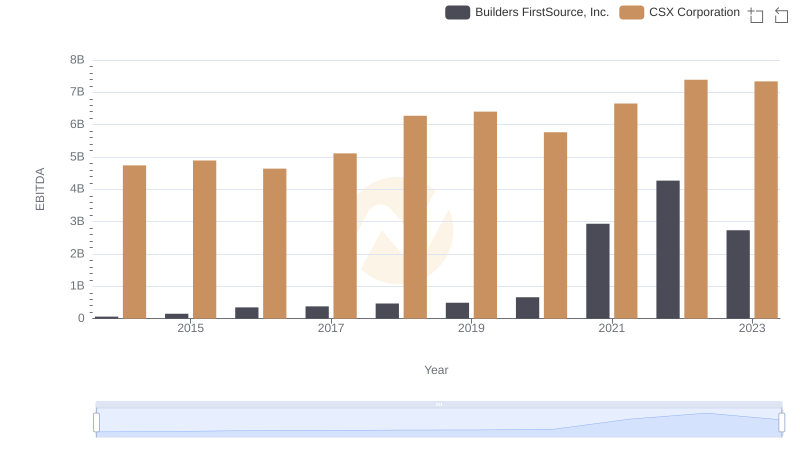
EBITDA Metrics Evaluated: CSX Corporation vs Builders FirstSource, Inc.
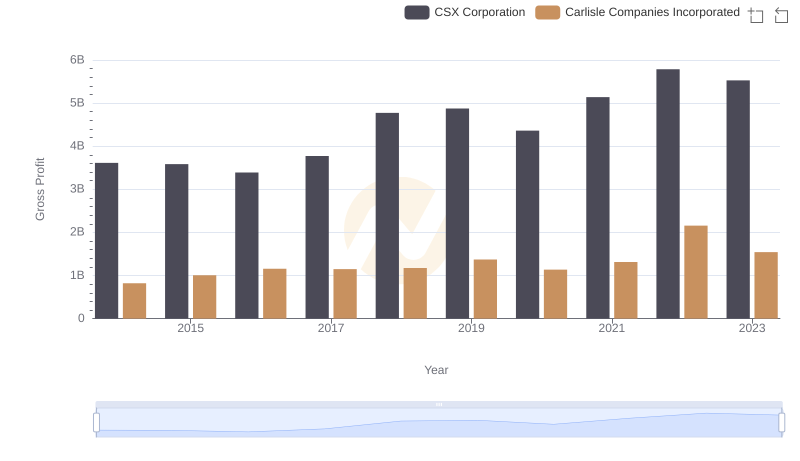
Gross Profit Analysis: Comparing CSX Corporation and Carlisle Companies Incorporated