| __timestamp | Builders FirstSource, Inc. | CSX Corporation |
|---|---|---|
| Wednesday, January 1, 2014 | 60008000 | 4740000000 |
| Thursday, January 1, 2015 | 148897000 | 4890000000 |
| Friday, January 1, 2016 | 346129000 | 4640000000 |
| Sunday, January 1, 2017 | 378096000 | 5113000000 |
| Monday, January 1, 2018 | 466874000 | 6274000000 |
| Tuesday, January 1, 2019 | 492344000 | 6402000000 |
| Wednesday, January 1, 2020 | 660420000 | 5764000000 |
| Friday, January 1, 2021 | 2934776000 | 6653000000 |
| Saturday, January 1, 2022 | 4267346000 | 7390000000 |
| Sunday, January 1, 2023 | 2734594000 | 7340000000 |
In pursuit of knowledge
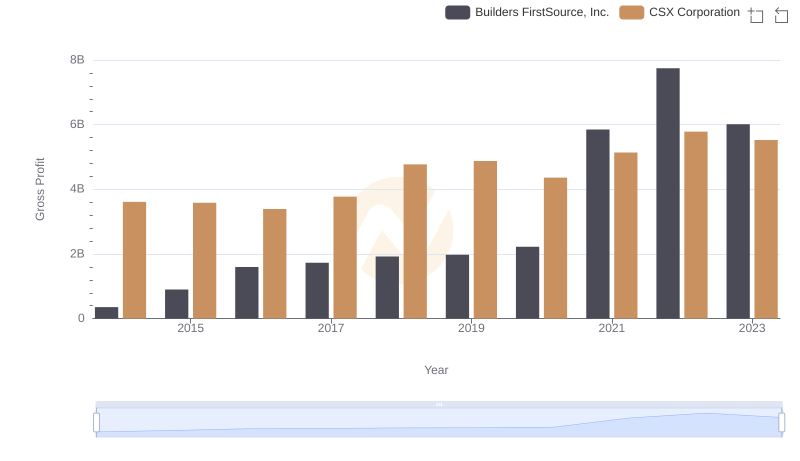
In the ever-evolving landscape of American industry, CSX Corporation and Builders FirstSource, Inc. have demonstrated remarkable financial trajectories over the past decade. From 2014 to 2023, CSX Corporation consistently showcased robust EBITDA growth, peaking at approximately $7.39 billion in 2022, a 56% increase from 2014. This reflects the company's strategic prowess in the transportation sector.
Conversely, Builders FirstSource, Inc. experienced a meteoric rise, with EBITDA surging from a modest $60 million in 2014 to an impressive $4.27 billion in 2022. This represents a staggering growth of over 7,000%, underscoring the company's dynamic expansion in the building materials industry.
These trends highlight the resilience and adaptability of both companies amidst economic fluctuations, offering valuable insights for investors and industry analysts alike. As we look to the future, the financial health of these corporations will continue to be a focal point for stakeholders.