| __timestamp | AerCap Holdings N.V. | CSX Corporation |
|---|---|---|
| Wednesday, January 1, 2014 | 1282919000 | 3613000000 |
| Thursday, January 1, 2015 | 1822255000 | 3584000000 |
| Friday, January 1, 2016 | 1686404000 | 3389000000 |
| Sunday, January 1, 2017 | 1660054000 | 3773000000 |
| Monday, January 1, 2018 | 1500345000 | 4773000000 |
| Tuesday, January 1, 2019 | 1678249000 | 4874000000 |
| Wednesday, January 1, 2020 | 1276496000 | 4362000000 |
| Friday, January 1, 2021 | 1301517000 | 5140000000 |
| Saturday, January 1, 2022 | 2109708000 | 5785000000 |
| Sunday, January 1, 2023 | 4337648000 | 5527000000 |
Unveiling the hidden dimensions of data
In the world of transportation and leasing, CSX Corporation and AerCap Holdings N.V. stand as titans. Over the past decade, these companies have showcased remarkable resilience and growth. From 2014 to 2023, CSX Corporation's gross profit surged by approximately 53%, peaking in 2022 with a 5.8 billion USD mark. Meanwhile, AerCap Holdings N.V. experienced a dramatic 238% increase, culminating in a staggering 4.3 billion USD in 2023.
This analysis underscores the dynamic nature of these industries and the strategic prowess of these companies in navigating economic challenges.
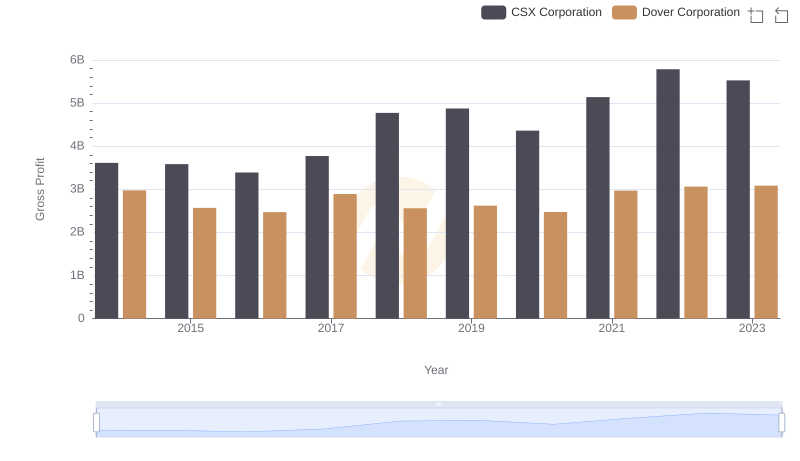
Key Insights on Gross Profit: CSX Corporation vs Dover Corporation

CSX Corporation and Lennox International Inc.: A Detailed Gross Profit Analysis
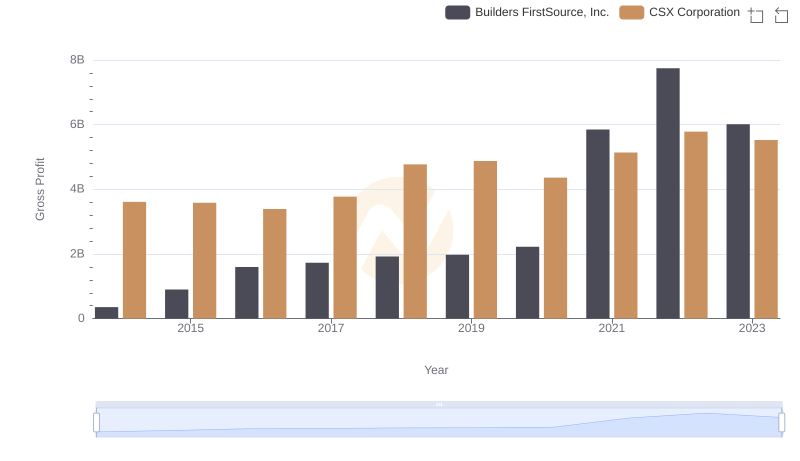
Gross Profit Trends Compared: CSX Corporation vs Builders FirstSource, Inc.
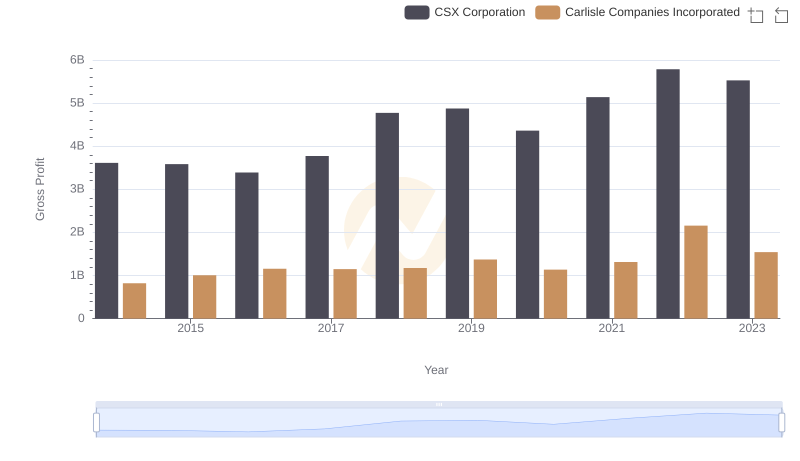
Gross Profit Analysis: Comparing CSX Corporation and Carlisle Companies Incorporated