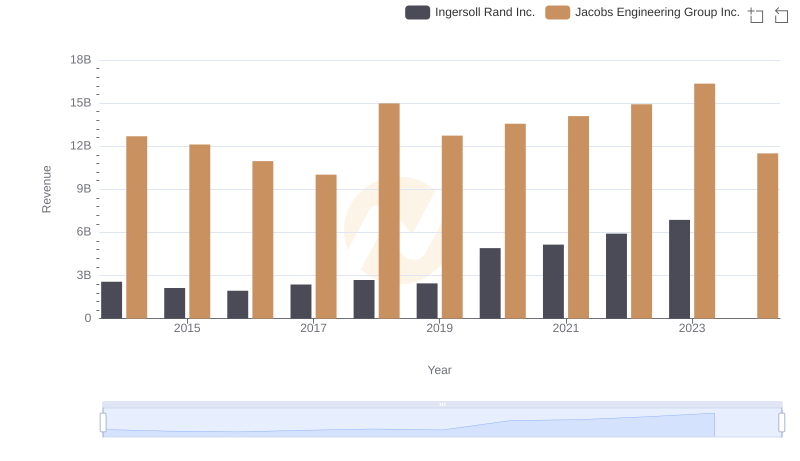
| __timestamp | Ingersoll Rand Inc. | Jacobs Engineering Group Inc. |
|---|---|---|
| Wednesday, January 1, 2014 | 936781000 | 2073784000 |
| Thursday, January 1, 2015 | 779100000 | 1968338000 |
| Friday, January 1, 2016 | 716731000 | 1767831000 |
| Sunday, January 1, 2017 | 897900000 | 1772252000 |
| Monday, January 1, 2018 | 1012500000 | 2828370000 |
| Tuesday, January 1, 2019 | 911700000 | 2477028000 |
| Wednesday, January 1, 2020 | 1613400000 | 2586668000 |
| Friday, January 1, 2021 | 1988500000 | 3043772000 |
| Saturday, January 1, 2022 | 2325600000 | 3327040000 |
| Sunday, January 1, 2023 | 2882200000 | 3473315000 |
| Monday, January 1, 2024 | 0 | 2832756000 |
Unveiling the hidden dimensions of data
In the competitive landscape of engineering and manufacturing, understanding financial performance is crucial for stakeholders. This article delves into the gross profit performance of two prominent companies in the sector: Ingersoll Rand Inc. and Jacobs Engineering Group Inc. Over the past decade, these firms have navigated various market dynamics, showcasing their resilience and adaptability.
From 2014 to 2023, both Ingersoll Rand and Jacobs Engineering have experienced significant fluctuations in their gross profit figures, reflecting broader economic trends and company-specific strategies. Ingersoll Rand, for instance, saw its gross profit grow from approximately $937 million in 2014 to an impressive $2.88 billion in 2023, marking an increase of nearly 208% over this period. This growth trajectory highlights the company’s effective operational strategies and market positioning.
In contrast, Jacobs Engineering has also demonstrated robust performance, with gross profits rising from about $2.07 billion in 2014 to approximately $3.47 billion in 2023. This represents a growth rate of around 68%, showcasing the company’s ability to capitalize on emerging opportunities in engineering and construction sectors.
Examining the yearly data reveals interesting insights into the performance ratios of both companies. For instance, in 2020, Ingersoll Rand experienced a substantial leap in gross profit, reaching $1.61 billion, which was around 80% higher than its 2019 figure. This spike can be attributed to strategic acquisitions and an increased demand for its products amid the pandemic recovery phase.
Conversely, Jacobs Engineering's gross profit peaked in 2022 at $3.33 billion, showcasing a steady growth pattern that outpaced Ingersoll Rand in certain years. The ability of Jacobs to maintain a consistent upward trajectory, even during economic downturns, underscores its strong market position and operational efficiency.
It is worth noting that while the data provides a comprehensive overview, there are gaps in the figures for 2024, particularly for Ingersoll Rand, where gross profit data is missing. This absence of data could imply ongoing strategic shifts or market adjustments that are yet to be reflected in financial results. As both companies continue to innovate and adapt to market conditions, stakeholders will be keenly watching how these trends evolve in the coming years.
In summary, the financial performance of Ingersoll Rand and Jacobs Engineering over the past decade illustrates the dynamic nature of the engineering and manufacturing sectors. With Ingersoll Rand achieving a remarkable growth rate of 208% in gross profits and Jacobs Engineering maintaining a solid 68% increase, both companies are well-positioned to navigate future challenges and opportunities. Investors and analysts alike should keep a close eye on these firms as they continue to shape the industry landscape.
Understanding these trends not only provides insights into each company’s operational effectiveness but also highlights the broader economic factors influencing their performance. As we look ahead, the ability of these companies to sustain their growth will be pivotal in determining their competitive edge in an ever-evolving market.
Ingersoll Rand Inc. and Jacobs Engineering Group Inc.: A Comprehensive Revenue Analysis
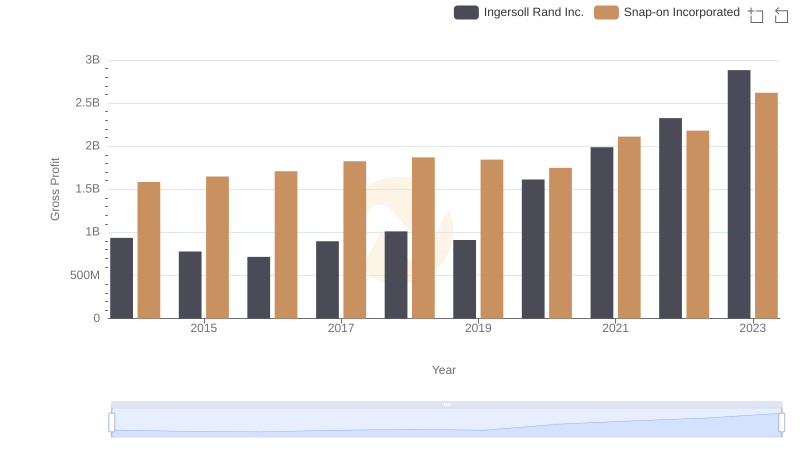
Key Insights on Gross Profit: Ingersoll Rand Inc. vs Snap-on Incorporated
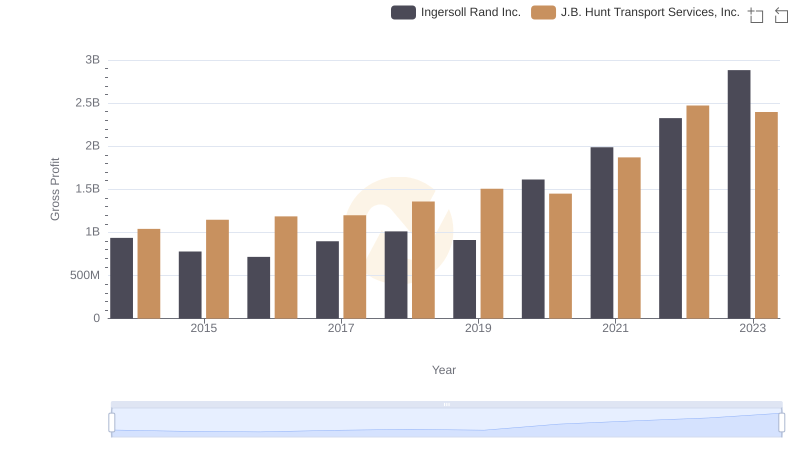
Gross Profit Comparison: Ingersoll Rand Inc. and J.B. Hunt Transport Services, Inc. Trends
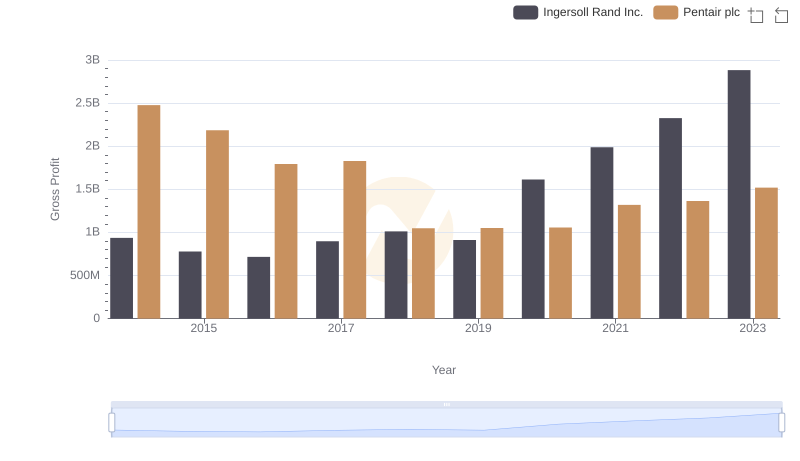
Ingersoll Rand Inc. vs Pentair plc: A Gross Profit Performance Breakdown
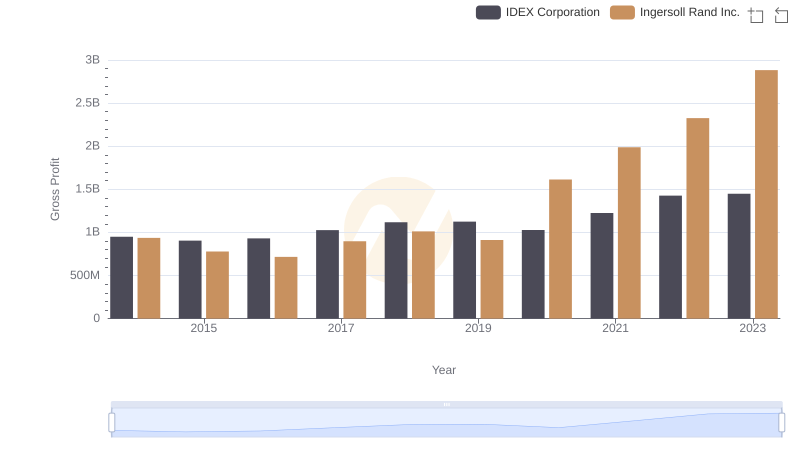
Gross Profit Analysis: Comparing Ingersoll Rand Inc. and IDEX Corporation
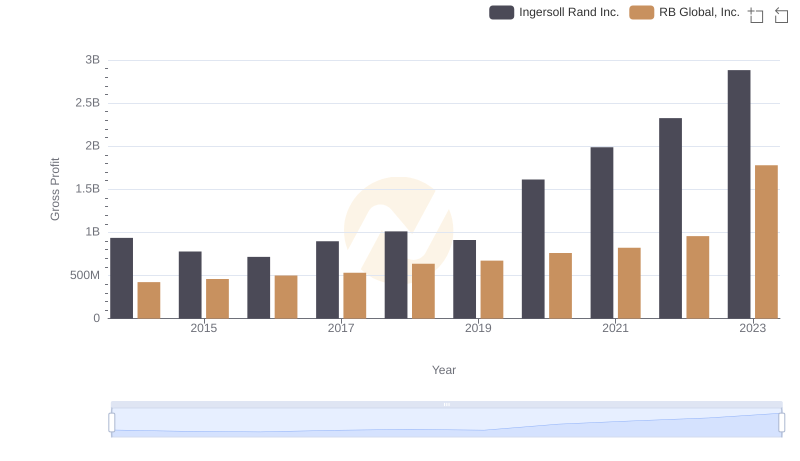
Gross Profit Analysis: Comparing Ingersoll Rand Inc. and RB Global, Inc.
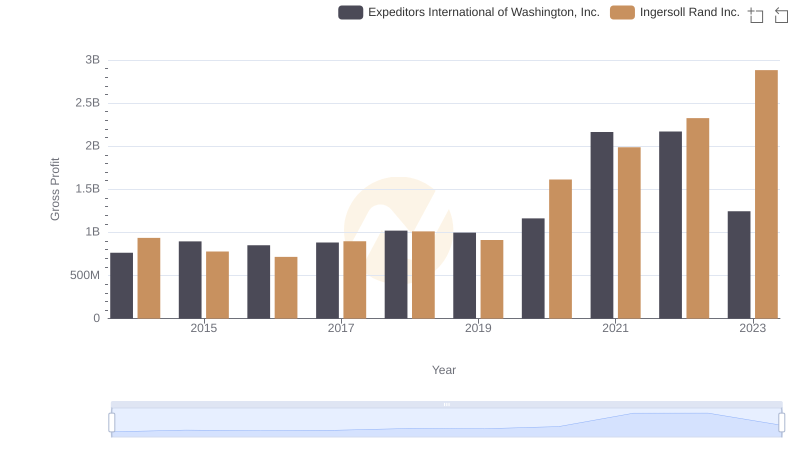
Who Generates Higher Gross Profit? Ingersoll Rand Inc. or Expeditors International of Washington, Inc.
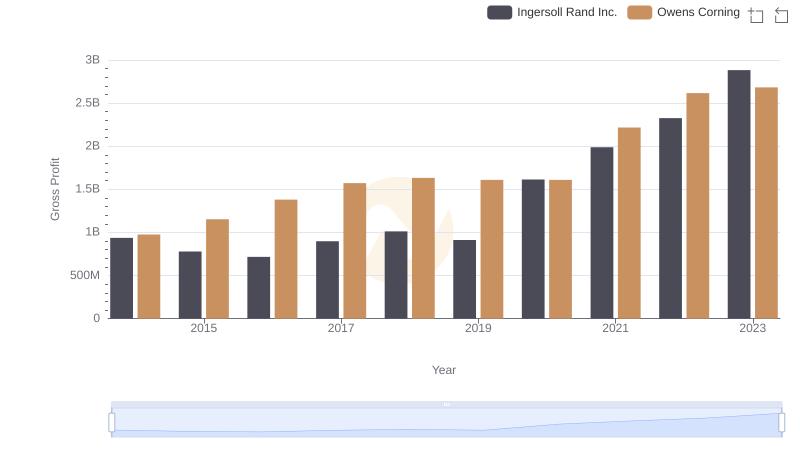
Who Generates Higher Gross Profit? Ingersoll Rand Inc. or Owens Corning