| __timestamp | Ingersoll Rand Inc. | Textron Inc. |
|---|---|---|
| Wednesday, January 1, 2014 | 2570005000 | 13878000000 |
| Thursday, January 1, 2015 | 2126900000 | 13423000000 |
| Friday, January 1, 2016 | 1939436000 | 13788000000 |
| Sunday, January 1, 2017 | 2375400000 | 14198000000 |
| Monday, January 1, 2018 | 2689800000 | 13972000000 |
| Tuesday, January 1, 2019 | 2451900000 | 13630000000 |
| Wednesday, January 1, 2020 | 4910200000 | 11651000000 |
| Friday, January 1, 2021 | 5152400000 | 12382000000 |
| Saturday, January 1, 2022 | 5916300000 | 12869000000 |
| Sunday, January 1, 2023 | 6876100000 | 13683000000 |
| Monday, January 1, 2024 | 0 | 13702000000 |
Unleashing insights
In the ever-evolving landscape of industrial giants, Ingersoll Rand Inc. and Textron Inc. have showcased intriguing revenue trajectories over the past decade. From 2014 to 2023, Ingersoll Rand's revenue surged by approximately 168%, peaking at $6.88 billion in 2023. This remarkable growth reflects a strategic pivot towards innovation and market expansion. Meanwhile, Textron Inc. maintained a steady revenue stream, with a slight dip in 2020, likely due to global economic challenges, but rebounding to $13.68 billion in 2023. This stability underscores Textron's resilience and diversified portfolio. Notably, the data for 2024 is incomplete, leaving room for speculation on future trends. As these industrial titans continue to navigate the complexities of the global market, their revenue patterns offer valuable insights into their strategic directions and market adaptability.
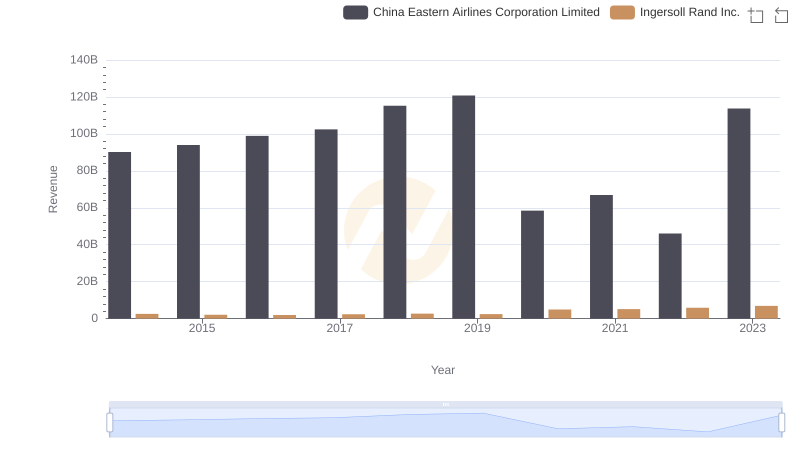
Who Generates More Revenue? Ingersoll Rand Inc. or China Eastern Airlines Corporation Limited
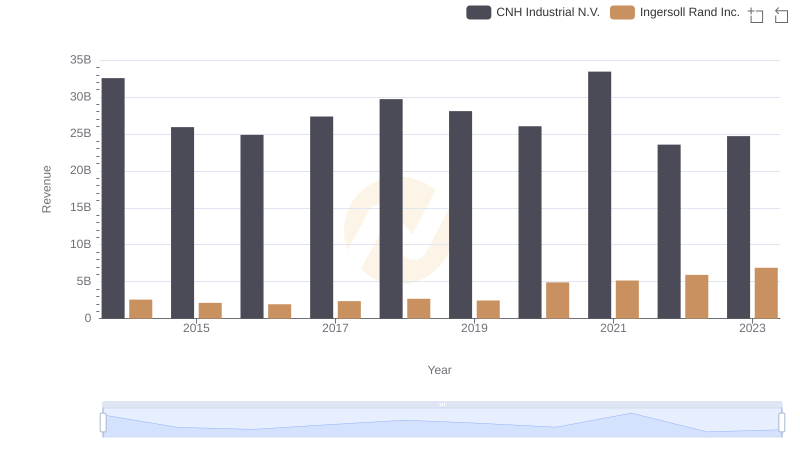
Ingersoll Rand Inc. vs CNH Industrial N.V.: Annual Revenue Growth Compared
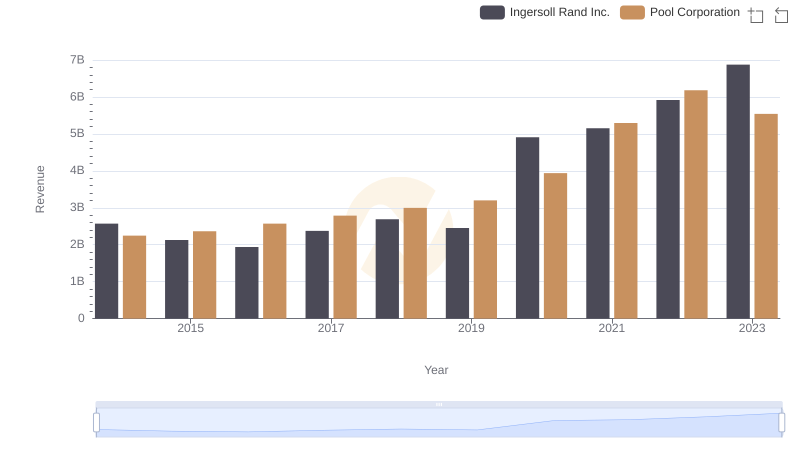
Ingersoll Rand Inc. vs Pool Corporation: Annual Revenue Growth Compared

Ingersoll Rand Inc. vs AECOM: Examining Key Revenue Metrics
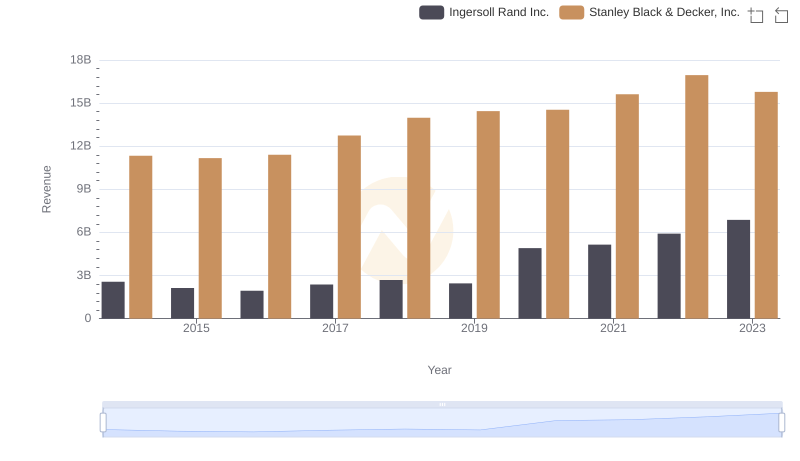
Ingersoll Rand Inc. or Stanley Black & Decker, Inc.: Who Leads in Yearly Revenue?
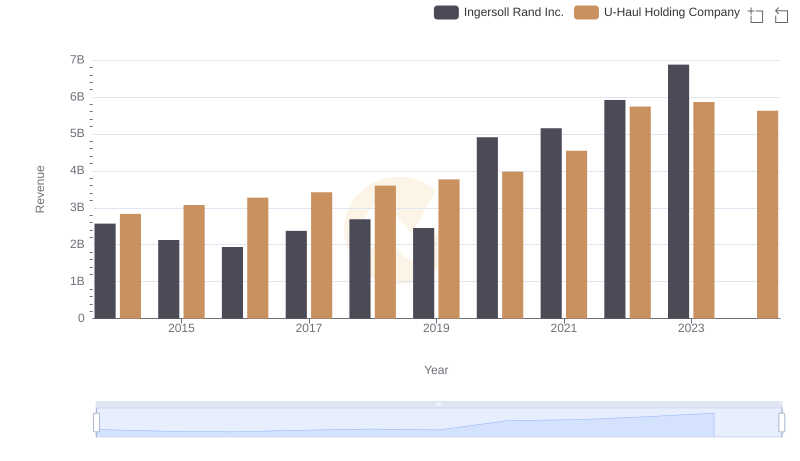
Revenue Showdown: Ingersoll Rand Inc. vs U-Haul Holding Company
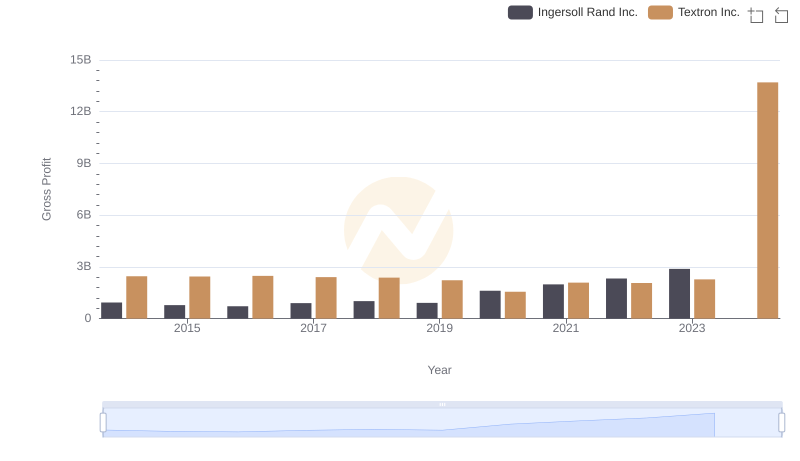
Gross Profit Analysis: Comparing Ingersoll Rand Inc. and Textron Inc.
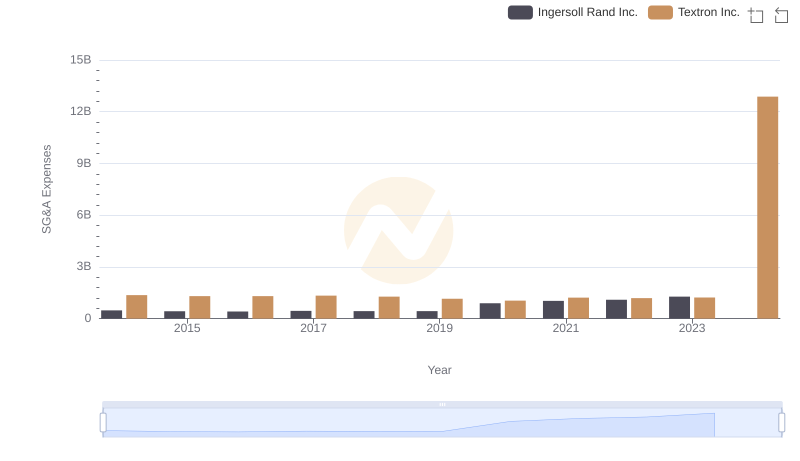
Ingersoll Rand Inc. or Textron Inc.: Who Manages SG&A Costs Better?