| __timestamp | Broadridge Financial Solutions, Inc. | Fidelity National Information Services, Inc. |
|---|---|---|
| Wednesday, January 1, 2014 | 376000000 | 810500000 |
| Thursday, January 1, 2015 | 396800000 | 1102800000 |
| Friday, January 1, 2016 | 420900000 | 1710000000 |
| Sunday, January 1, 2017 | 501400000 | 1442000000 |
| Monday, January 1, 2018 | 565400000 | 1301000000 |
| Tuesday, January 1, 2019 | 577500000 | 2667000000 |
| Wednesday, January 1, 2020 | 639000000 | 3516000000 |
| Friday, January 1, 2021 | 744300000 | 3938000000 |
| Saturday, January 1, 2022 | 832300000 | 4118000000 |
| Sunday, January 1, 2023 | 849000000 | 2096000000 |
| Monday, January 1, 2024 | 916800000 | 2185000000 |
Infusing magic into the data realm
In the ever-evolving financial landscape, understanding the trends in Selling, General, and Administrative (SG&A) expenses is crucial for investors and analysts alike. Over the past decade, Broadridge Financial Solutions, Inc. and Fidelity National Information Services, Inc. have shown distinct trajectories in their SG&A expenses.
Broadridge has seen a steady increase, with expenses rising by approximately 144% from 2014 to 2024. This growth reflects their strategic investments in technology and infrastructure. In contrast, Fidelity National Information Services experienced a more volatile pattern, peaking in 2022 with a 408% increase from 2014, before a notable decline in 2023. This fluctuation may indicate shifts in their operational strategies or market conditions.
These insights into SG&A trends provide a window into the companies' operational efficiencies and strategic priorities, offering valuable information for stakeholders and potential investors.
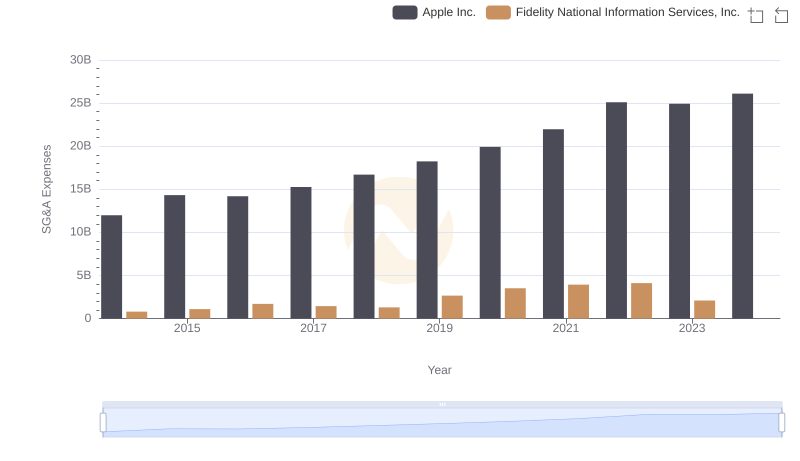
Apple Inc. and Fidelity National Information Services, Inc.: SG&A Spending Patterns Compared
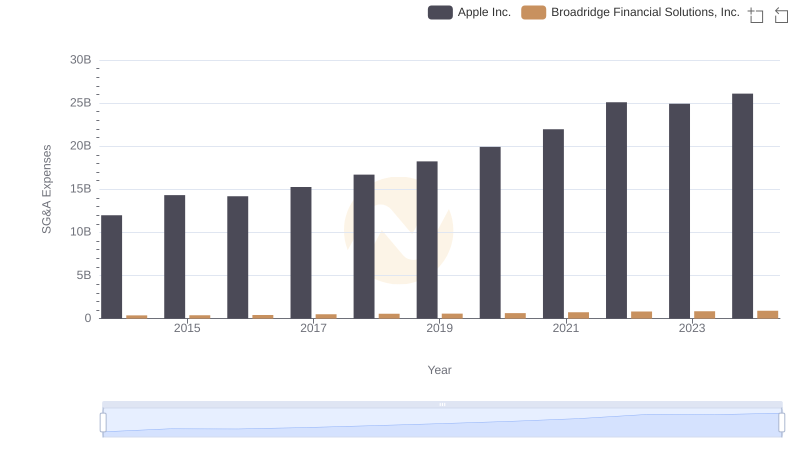
Apple Inc. vs Broadridge Financial Solutions, Inc.: SG&A Expense Trends
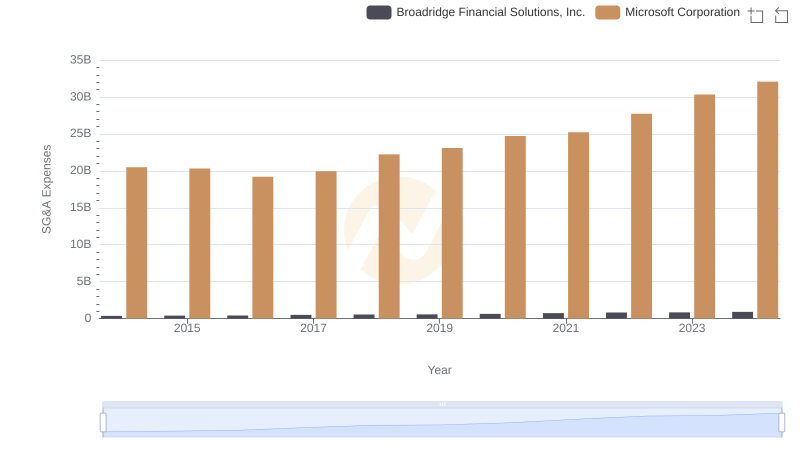
Microsoft Corporation or Broadridge Financial Solutions, Inc.: Who Manages SG&A Costs Better?
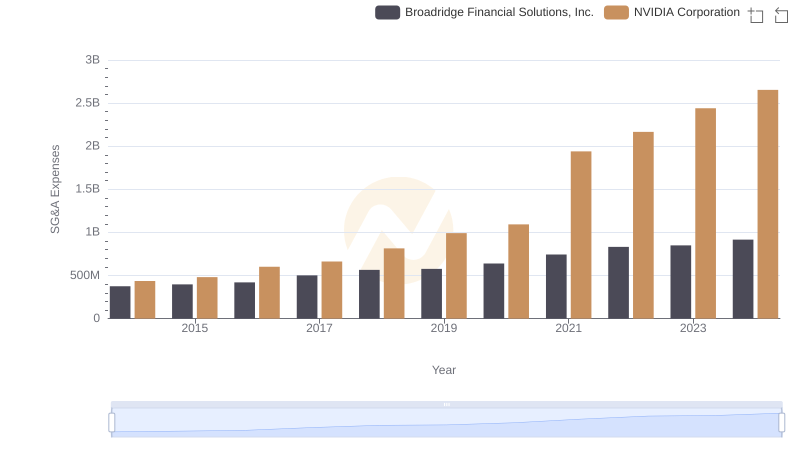
NVIDIA Corporation vs Broadridge Financial Solutions, Inc.: SG&A Expense Trends
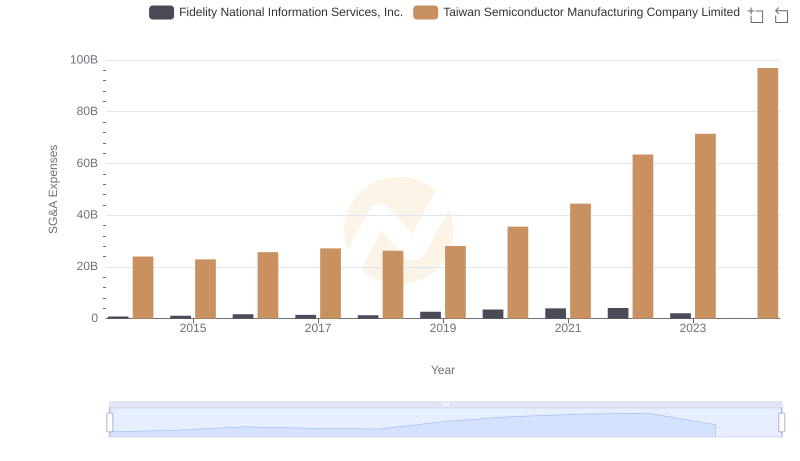
Cost Management Insights: SG&A Expenses for Taiwan Semiconductor Manufacturing Company Limited and Fidelity National Information Services, Inc.
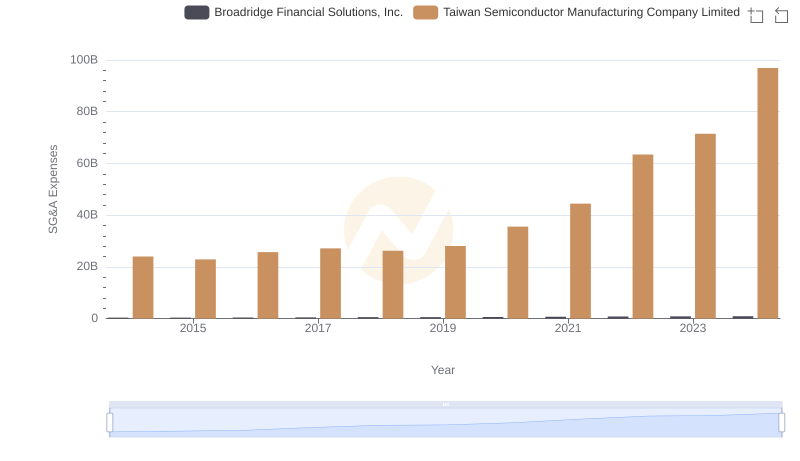
Operational Costs Compared: SG&A Analysis of Taiwan Semiconductor Manufacturing Company Limited and Broadridge Financial Solutions, Inc.
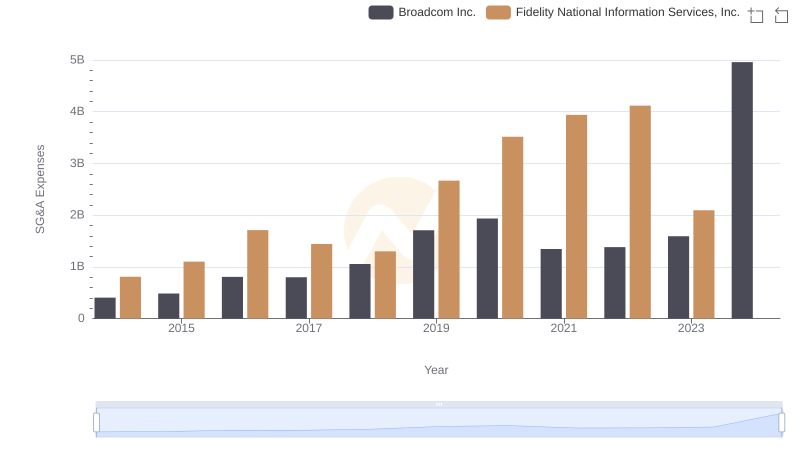
Comparing SG&A Expenses: Broadcom Inc. vs Fidelity National Information Services, Inc. Trends and Insights
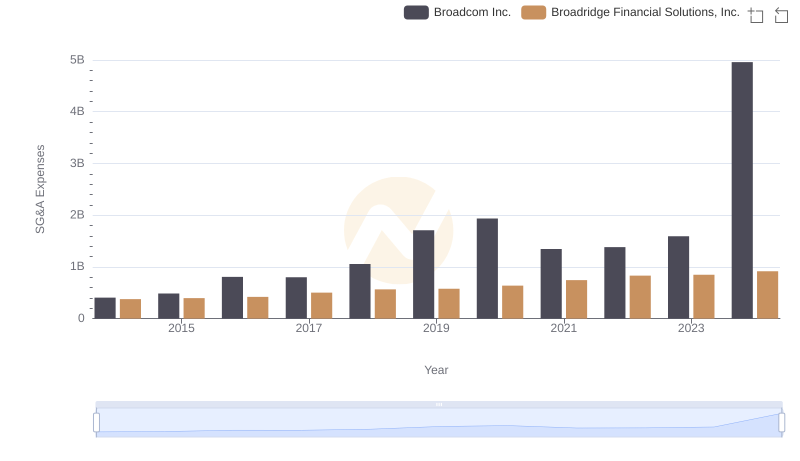
Who Optimizes SG&A Costs Better? Broadcom Inc. or Broadridge Financial Solutions, Inc.
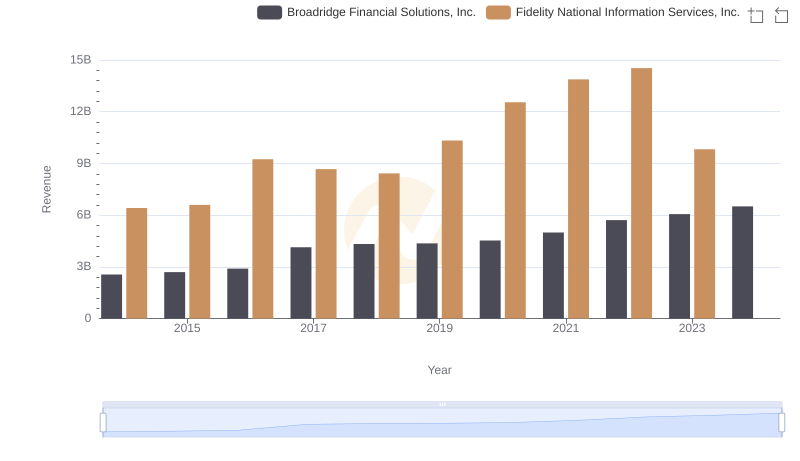
Revenue Insights: Fidelity National Information Services, Inc. and Broadridge Financial Solutions, Inc. Performance Compared
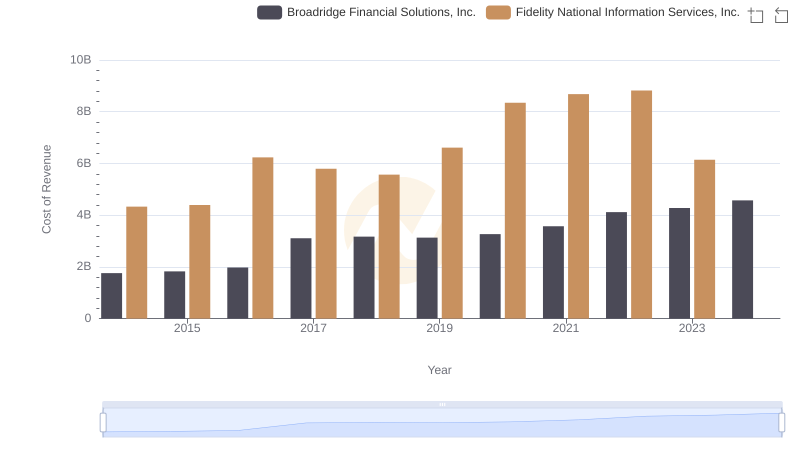
Analyzing Cost of Revenue: Fidelity National Information Services, Inc. and Broadridge Financial Solutions, Inc.
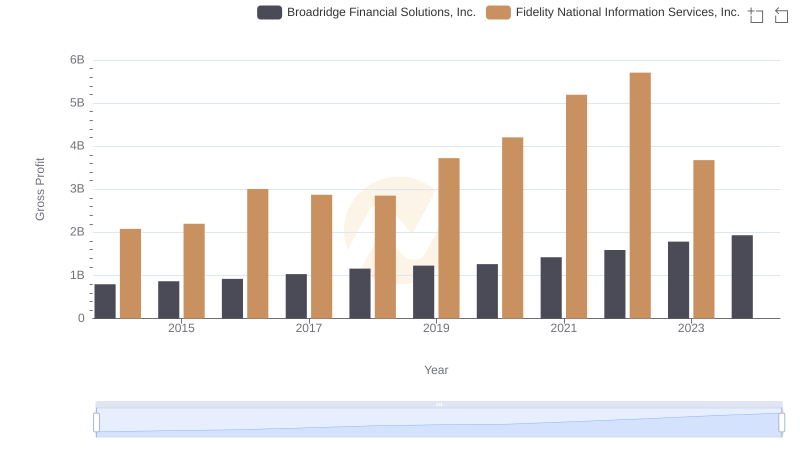
Gross Profit Analysis: Comparing Fidelity National Information Services, Inc. and Broadridge Financial Solutions, Inc.
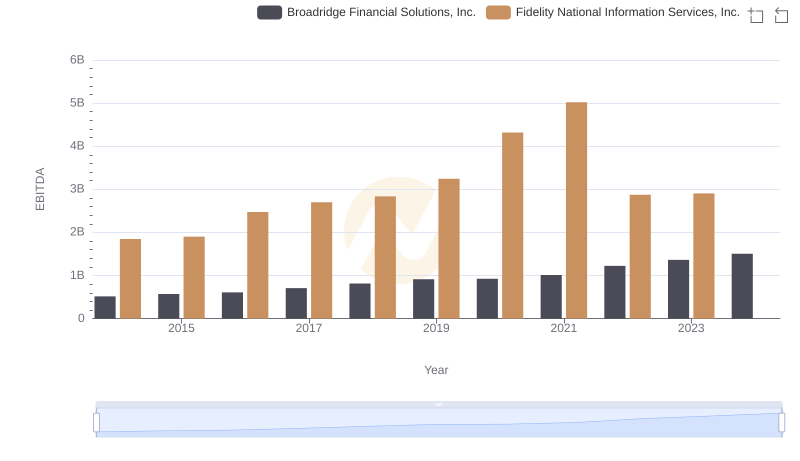
A Professional Review of EBITDA: Fidelity National Information Services, Inc. Compared to Broadridge Financial Solutions, Inc.