| __timestamp | Broadridge Financial Solutions, Inc. | Fidelity National Information Services, Inc. |
|---|---|---|
| Wednesday, January 1, 2014 | 1761400000 | 4332700000 |
| Thursday, January 1, 2015 | 1828200000 | 4393200000 |
| Friday, January 1, 2016 | 1975900000 | 6233000000 |
| Sunday, January 1, 2017 | 3109600000 | 5794000000 |
| Monday, January 1, 2018 | 3169600000 | 5569000000 |
| Tuesday, January 1, 2019 | 3131900000 | 6610000000 |
| Wednesday, January 1, 2020 | 3265100000 | 8348000000 |
| Friday, January 1, 2021 | 3570800000 | 8682000000 |
| Saturday, January 1, 2022 | 4116900000 | 8820000000 |
| Sunday, January 1, 2023 | 4275500000 | 6145000000 |
| Monday, January 1, 2024 | 4572900000 | 6323000000 |
Igniting the spark of knowledge
In the ever-evolving landscape of financial services, understanding cost structures is crucial for strategic decision-making. This analysis delves into the cost of revenue trends for two industry giants: Broadridge Financial Solutions, Inc. and Fidelity National Information Services, Inc., from 2014 to 2023.
Broadridge Financial Solutions has seen a steady increase in its cost of revenue, growing by approximately 160% over the decade. Notably, the cost surged from 2017 onwards, reflecting strategic investments and market expansion. In contrast, Fidelity National Information Services experienced a more volatile trajectory, with a peak in 2022, followed by a significant drop in 2023, indicating potential shifts in operational strategies or market conditions.
These insights highlight the dynamic nature of financial services, where companies must continuously adapt to maintain competitive advantage. Missing data for 2024 suggests ongoing developments, warranting close monitoring for future trends.
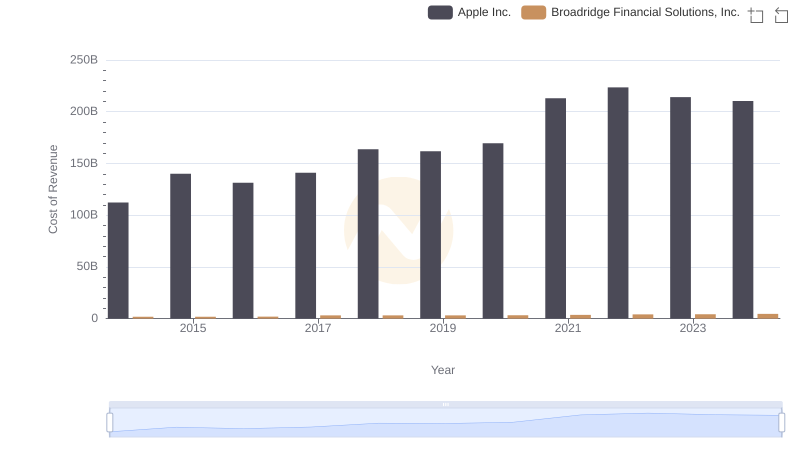
Analyzing Cost of Revenue: Apple Inc. and Broadridge Financial Solutions, Inc.
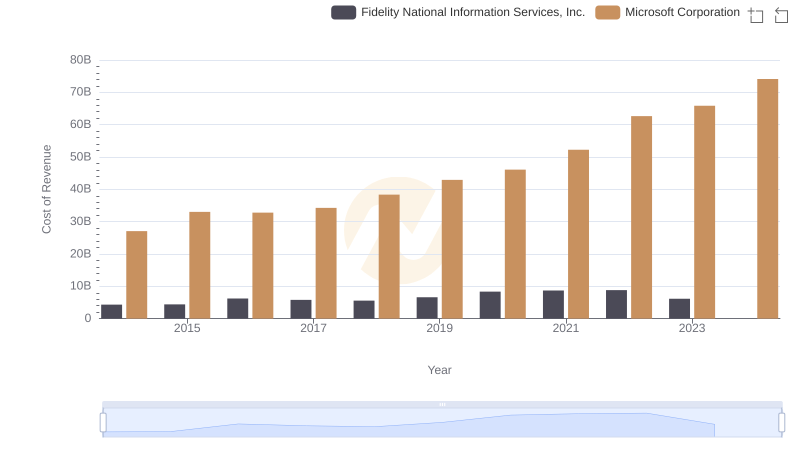
Cost of Revenue Trends: Microsoft Corporation vs Fidelity National Information Services, Inc.
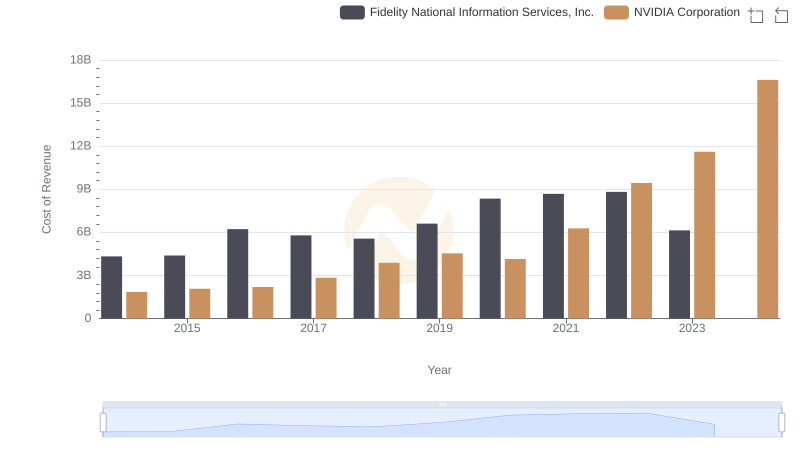
Cost of Revenue Trends: NVIDIA Corporation vs Fidelity National Information Services, Inc.
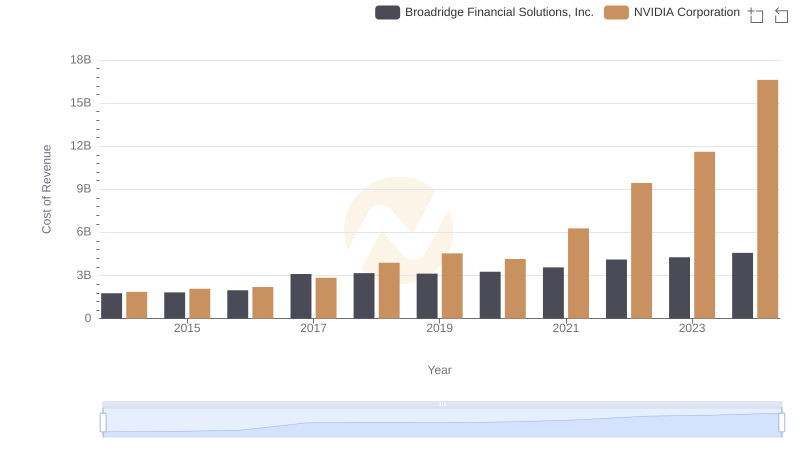
Comparing Cost of Revenue Efficiency: NVIDIA Corporation vs Broadridge Financial Solutions, Inc.
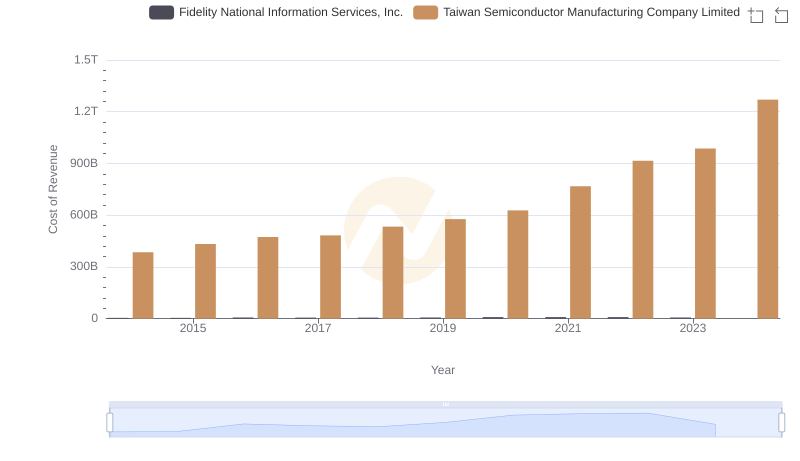
Cost Insights: Breaking Down Taiwan Semiconductor Manufacturing Company Limited and Fidelity National Information Services, Inc.'s Expenses
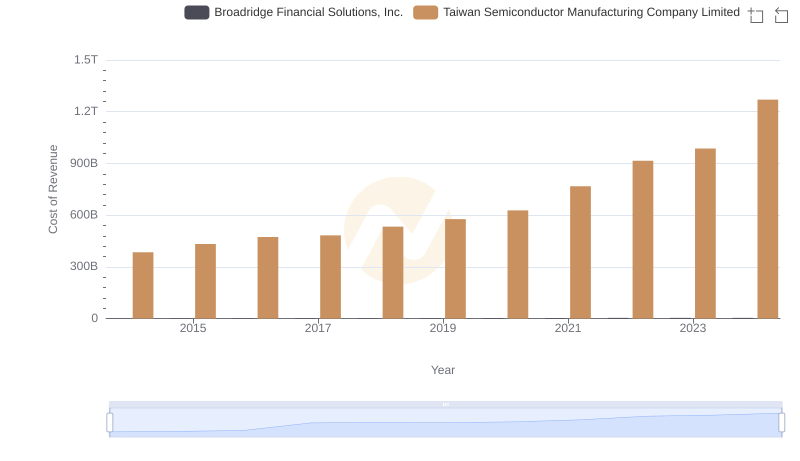
Cost Insights: Breaking Down Taiwan Semiconductor Manufacturing Company Limited and Broadridge Financial Solutions, Inc.'s Expenses
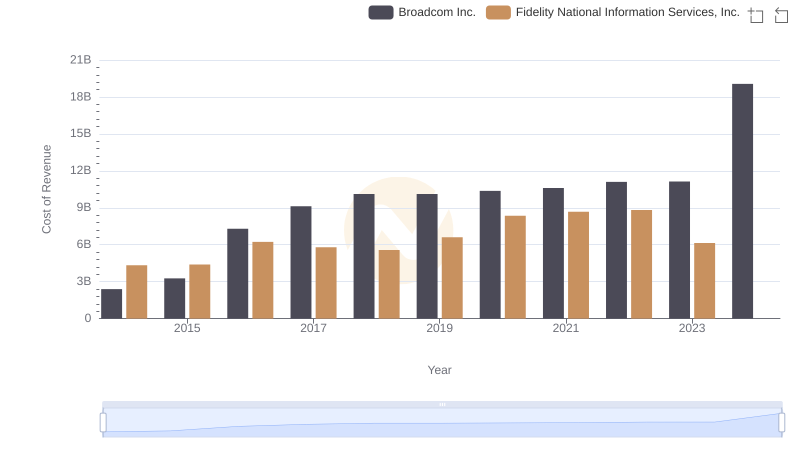
Comparing Cost of Revenue Efficiency: Broadcom Inc. vs Fidelity National Information Services, Inc.
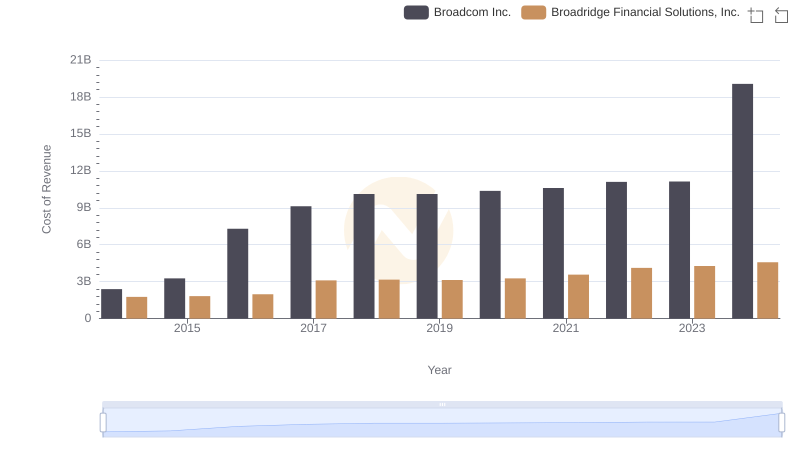
Cost Insights: Breaking Down Broadcom Inc. and Broadridge Financial Solutions, Inc.'s Expenses
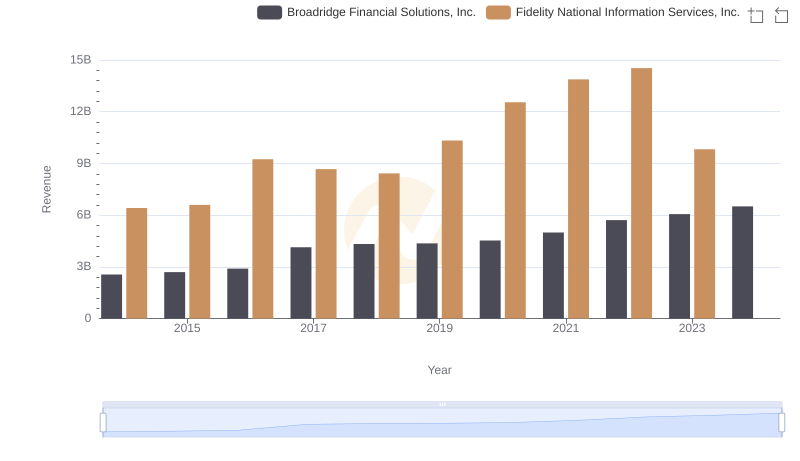
Revenue Insights: Fidelity National Information Services, Inc. and Broadridge Financial Solutions, Inc. Performance Compared
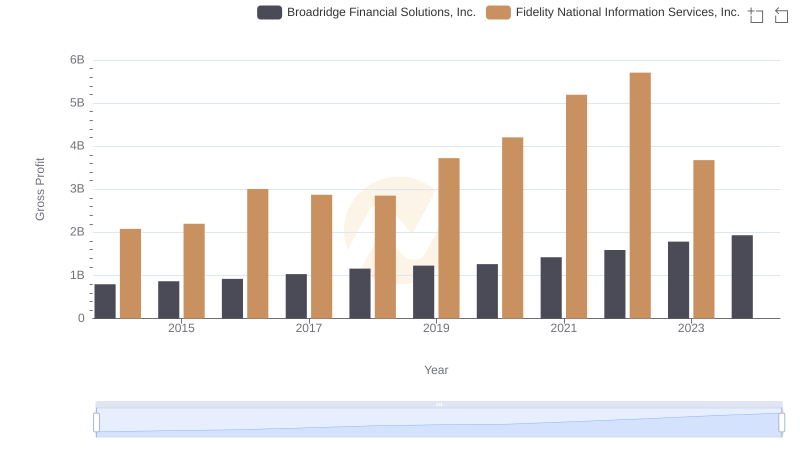
Gross Profit Analysis: Comparing Fidelity National Information Services, Inc. and Broadridge Financial Solutions, Inc.
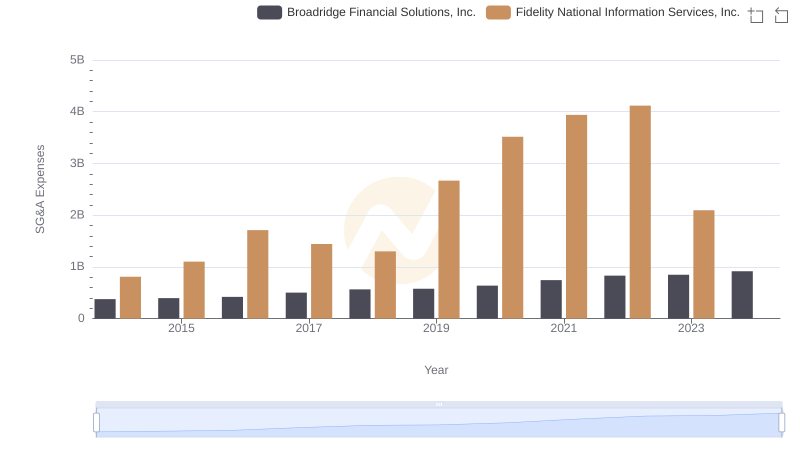
Fidelity National Information Services, Inc. vs Broadridge Financial Solutions, Inc.: SG&A Expense Trends
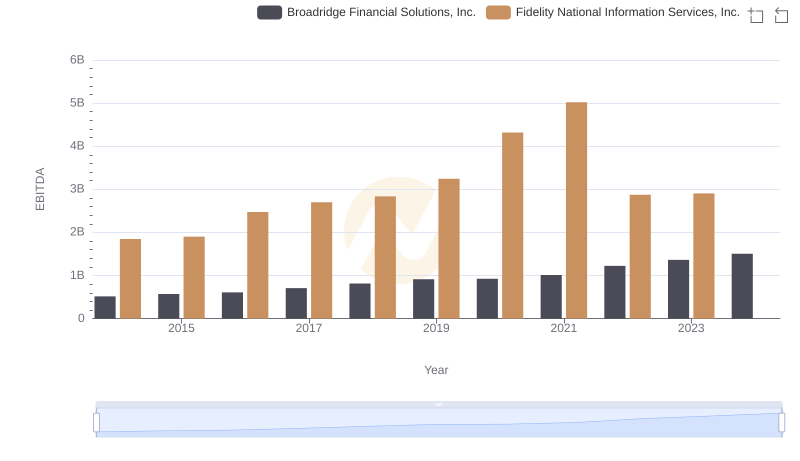
A Professional Review of EBITDA: Fidelity National Information Services, Inc. Compared to Broadridge Financial Solutions, Inc.