| __timestamp | Elbit Systems Ltd. | Global Payments Inc. |
|---|---|---|
| Wednesday, January 1, 2014 | 358274000 | 594102000 |
| Thursday, January 1, 2015 | 390932000 | 618109000 |
| Friday, January 1, 2016 | 424003291 | 748136000 |
| Sunday, January 1, 2017 | 438616108 | 1010019000 |
| Monday, January 1, 2018 | 374866620 | 1315968000 |
| Tuesday, January 1, 2019 | 502866000 | 1764994000 |
| Wednesday, January 1, 2020 | 484464000 | 2508393000 |
| Friday, January 1, 2021 | 576645646 | 3233589000 |
| Saturday, January 1, 2022 | 505269000 | 2427684000 |
| Sunday, January 1, 2023 | 544811000 | 3606789000 |
| Monday, January 1, 2024 | 2333605000 |
Unleashing the power of data
In the ever-evolving landscape of global finance, understanding the financial health of companies is crucial. This analysis delves into the EBITDA trends of two industry giants: Global Payments Inc. and Elbit Systems Ltd., from 2014 to 2023. Over this period, Global Payments Inc. has demonstrated a robust growth trajectory, with its EBITDA surging by over 530%, peaking in 2023. In contrast, Elbit Systems Ltd. has shown a steadier, albeit slower, growth of approximately 52% over the same period. Notably, Global Payments Inc. experienced a significant leap in 2021, marking a 29% increase from the previous year, while Elbit Systems Ltd. reached its highest EBITDA in 2021. This comparison highlights the dynamic nature of financial performance across different sectors, offering valuable insights for investors and analysts alike.
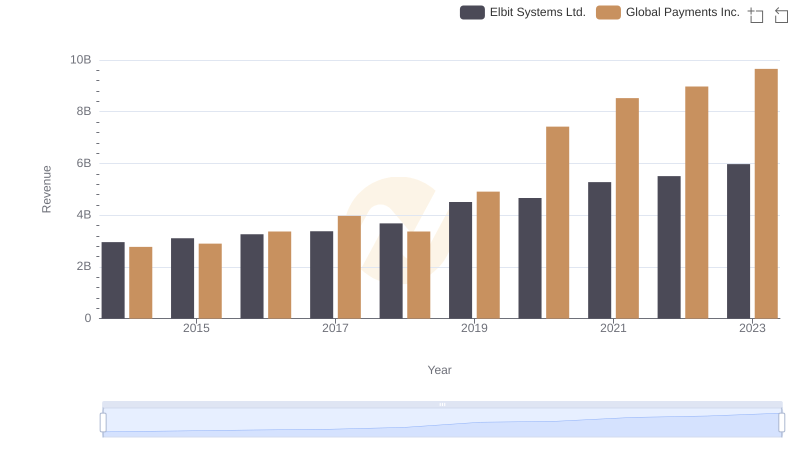
Global Payments Inc. vs Elbit Systems Ltd.: Annual Revenue Growth Compared
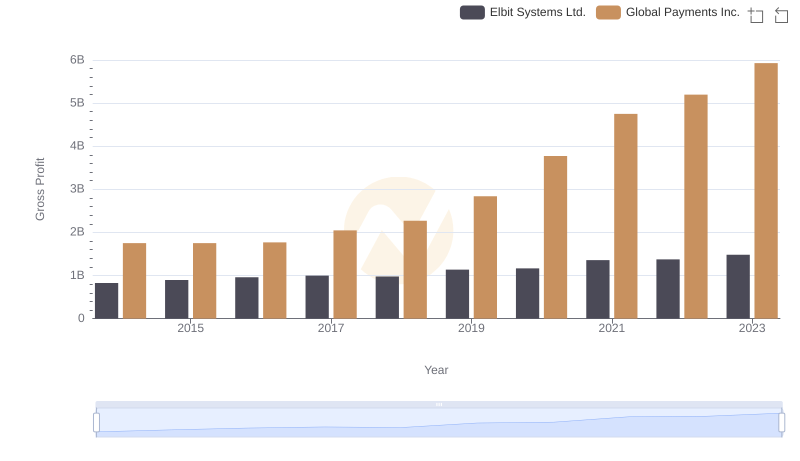
Gross Profit Analysis: Comparing Global Payments Inc. and Elbit Systems Ltd.
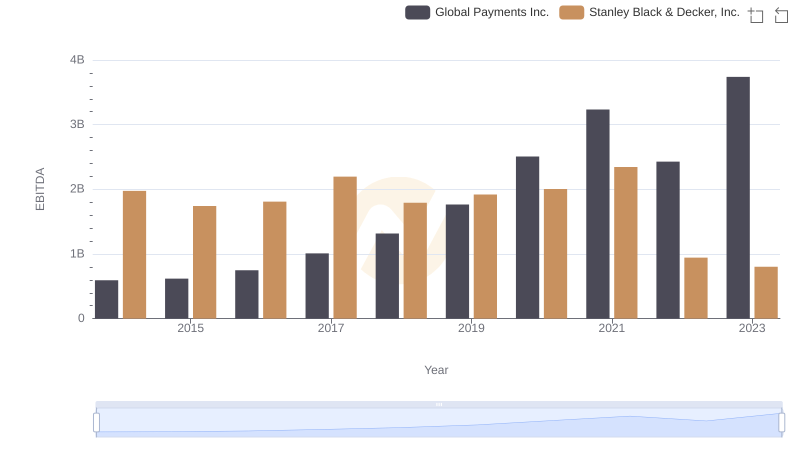
Comprehensive EBITDA Comparison: Global Payments Inc. vs Stanley Black & Decker, Inc.
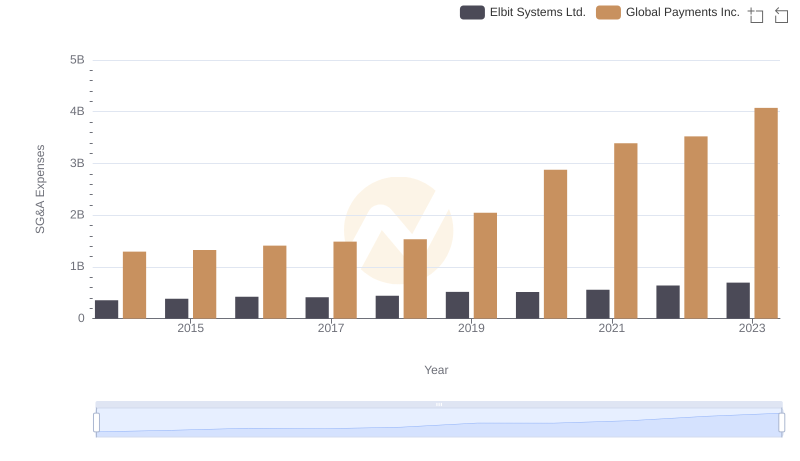
Global Payments Inc. or Elbit Systems Ltd.: Who Manages SG&A Costs Better?
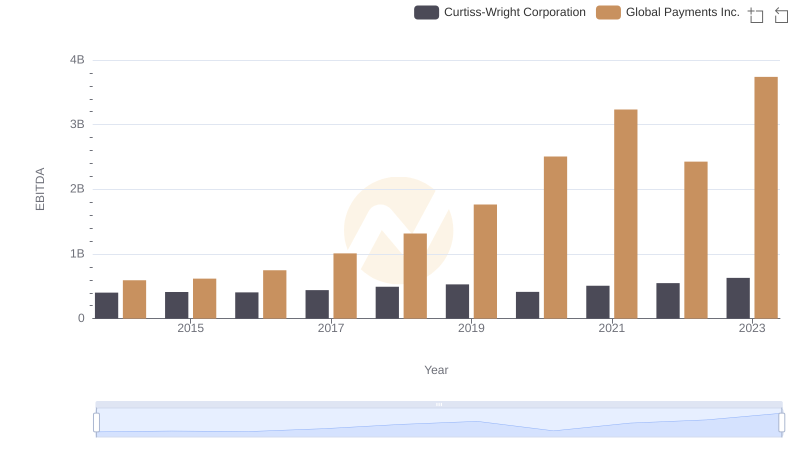
Professional EBITDA Benchmarking: Global Payments Inc. vs Curtiss-Wright Corporation
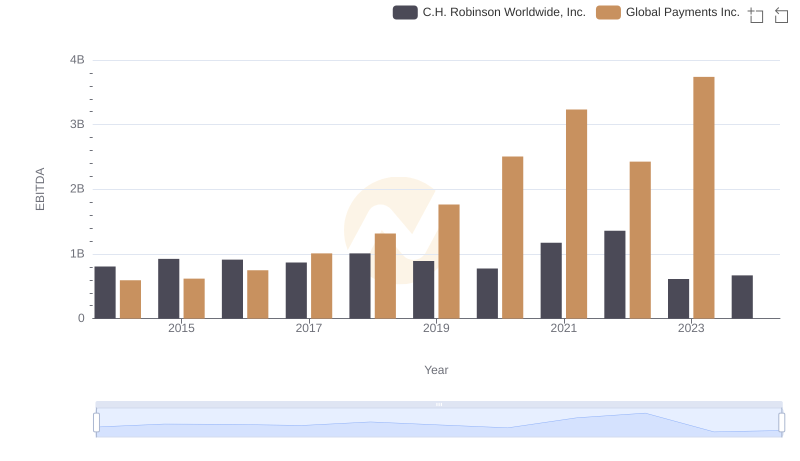
A Side-by-Side Analysis of EBITDA: Global Payments Inc. and C.H. Robinson Worldwide, Inc.